Current status of energy market.

The oil price (link 2, link 3, link 4 (WCS)) can be predicted based on oil supply and demand numbers. Demand can be correlated to U.S. GDP while supply can be correlated to production. I added the Chinese yuan exchange rate to include Chinese oil demand, which is a large part of oil demand.
The same chart below but GDP substituted by credit spreads.
The oil price is a leading indicator for rig counts. If you see the oil price (green line) go down, the rig count (blue line) will go down as well. Later on, the oil production (light blue line) will go down.
Oil price = Green line
Rig counts = Blue line
Rig counts = Blue line
Oil production = Light blue line
Macro-economic indicators from the EIA should be monitored. Check the latest news here.
- Shale gas production (decline rates)
- EU natural gas storage (link 2)
- EU natural gas demand
- Fair value price of gas
- EU electricity production by source (German demand, UK demand)
- LNG production and LNG price
- Weather forecast and polar vortex
- Distillate demand and China oil demand
- Global oil supply and demand
- Oil refinery demand
- Crack spreads
- Bullish percentage index
- Drilled Uncompleted Wells and Shale oil/gas production (Permian/Haynesville/Appalachia/Bakken/Anadarko/Eagle Ford/Niobrara)
- Baker Hughes rig count or Enverus rig counts or oil/gas rig counts (link 2)
- Refinery net production
- Weekly oil production
- Weekly oil stock levels
- SPR level
- Natural gas production (alternative link)
- Natural gas plant liquids production
- Weekly supply of petroleum products (proxy for consumer oil demand)
- Canadian pipeline exports of natural gas to U.S.
- LNG exports
- Mexico exports
- Oil Stress Dashboard
Make sure to check the uranium price because uranium is a leading indicator for oil.
Make sure to check the GDP outlook from the Atlanta Fed.
Check the bullish percentage energy index. Alternative link.

Check rig count.

Check the futures curve.


Check comparative inventory.

Check COT report.

Check the Near Term Forward Spread.

Check the Minfutures oil report.
Check the seasonality on oil and gas.


Check natural gas consumption.
Check natural gas supply.


Check the WCS-WTI differential. WCS should close in on WTI due to the Trans Mountain Pipeline going in production in 2024.


Check the average inflation adjusted oil price.

Check that oil open interest (link 2) is rising (leading indicator).


Check shale oil production (which is going bust).

Check global oil production.


Check oil inventories.


Check natural gas inventories.


Oil CAPEX is at decade lows and should support higher oil prices. Watch the oil CAPEX/Sales ratio. Whenever this is below historic average, you are in an oil bull market.


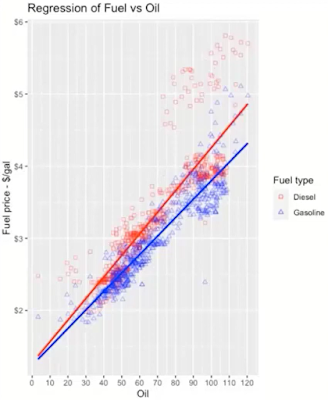
Check the correlation between oil and gasoline/diesel/natgas via crack spreads. Crack spreads are a 1-month leading indicator for oil prices.


2022

2023


Oil price in function of demand.


Oil consumption in function of GDP.

Check energy as a percentage of the SP500.

Check the VLCC floating storage, which is inversely correlated to oil prices.

Nenner forecast.


Geen opmerkingen:
Een reactie posten