The Stock Forecaster Index can predict the movement of stocks and is based on the following parameters:


- Fed balance sheet expansion
- Credit spreads
- Initial jobless claims
The Brave-Butters-Kelley index is leading the stock market.
Check the P/E Ratio. The lower the better.
Check the Buffett Rule. The lower the better.
Check the Bullish Percentage Index.
Check the Euphoria.
Check the cycle.
Check the NFIB business optimism index.
Check leading indicators. U.S. leading indicators can be found here.
The Fed has its stock valuation model. Compare bond yields vs. stock market earnings yield (link 2).
Foreign holdings of U.S. equities.
Yardeni's forecast can be found here.


Yardeni S&P500 earnings can be found here. Earnings per sector can be found here. PE ratios can be found here for each country.
- SP500
- SP400
- SP600

Growth Vs. Value stocks.
Watch the Put Call ratio for short term movements.

Stock valuation.
Check the Mannarino Index. Low index means low risk, High index means high risk.
The NAHB housing market index is leading the business cycle.

Real sales to private purchasers are a better measure for GDP.
Charles Nenner Cycle.

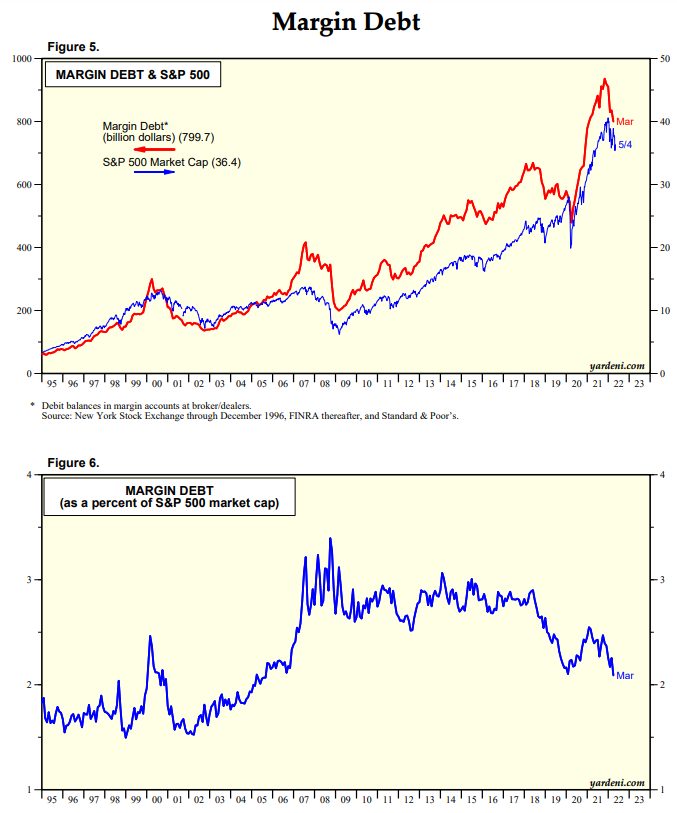
Margin accounts are a leading indicator.
CAPEX is a leading indicator for equity returns.

The Black Swan Indicator tells us when to buy or sell stocks.

Check the Smart Money Flow Index, as it accurately predicts the future performance of the Dow Jones.


Check the housing market Redfin data for price drops pointing to a recession.

Another way to look at this is to calculate the annualized equity return based on this formula: (equity+debt)/market value of equity. The black line shows the annualized stock return that investors earned over the subsequent 10 years.

Equity allocation is inversely correlated to equity returns.

Market cap to gross value added ratio.


Part-time and over-time workers are a leading indicator for a recession as they are fired first.
Truck tonnage is correlated to stocks.

Corporate profits can be forecasted using government deficit and consumer savings numbers.

Since 2020, the central banks fully control the stock market via the formula:
Net liquidity = Fed Assets - TGA - Reverse Repo
Goods spending predicts recessions and unemployment rate.
Check bank tightening conditions.
Check ISM manufacturing new orders.

Check building permits.
If they stop hiking rates, stocks will fall.
The Citigroup economic surprise index gives the risk of recession.

The near term forward spread is a predictor of a recession.

An inverted yield curve predicts recessions.
GDP converges on GDI. Watch the gap.
Home builder index XHB is a leading indicator for stocks.

Buy stocks when VIX is at 30, sell stocks when VIX is at 20.

Nenner cycle.

For more indicators go here.
Geen opmerkingen:
Een reactie posten