Posts tonen met het label stock. Alle posts tonen

zaterdag 30 maart 2024

Stock-Bond Correlation is Positive

The stock bond correlation is still in positive territory. This means gold goes up with rising bond yields.


woensdag 3 januari 2024

Stock Bond Correlation Vs. Gold Yield

Stock-bond correlation is strengthening.


This means gold will rise on higher yields.


Historically, bonds and stocks are positively correlated.


zaterdag 17 juni 2023

Gold is money

Gold is monetary and should not be seen as a commodity. It is money and depends on the 4 prices of money. It's less dependent on mine supply because the stock to flow ratio is very high. Read this article.


zaterdag 28 mei 2022

Low Aluminum Stock

Aluminum is in short supply, this metal could shoot up quickly. Buy Alcoa, Rio Tinto.


woensdag 16 maart 2022

Aluminum, Copper, Zinc, Nickel Are in Deficit

Aluminum, copper, zinc and nickel will be in severe deficit. Russia is just a bonus.


Stock levels are low, especially nickel.

vrijdag 25 juni 2021

Global copper stock levels are at all time lows

When stock levels come down in the second half of the year, copper prices could surge. 


dinsdag 27 april 2021

Copper Stock Level Vs. Copper Price

When copper warehouse stock levels go down, this indicates there is a shortage. Copper price goes up.


Capstone Mining reports the following warehouse levels.

Trafigura reports that copper stock levels are at all time lows. Seasonally speaking, copper stock levels should come down in the second half of the year.


The LME is the best way to monitor this as it is the largest warehouse.


vrijdag 16 oktober 2020

Oil Demand Is Stalling

 Oil demand has not picked up.


Refinery inputs are not picking up.


Oil stock levels are declining but there is still too much oil out there.


Oil majors are in a lot of trouble who need an oil price of at least $50/barrel to sustain dividends.


donderdag 20 augustus 2020

Robinhood Traders Vs. Stock Market

Robinhood traders have a very good track record in frontrunning the market as some of these examples show. When they buy, you buy. When they stop buying (flatlined) or are selling, then you sell.

Alamos Gold

Endeavour Silver


Halliburton


Alaska Air


UPS


Intel


zaterdag 20 juni 2020

GLD Trust Gold Stock Level Reaches Multiple Year High

We haven't seen these gold stock levels in the GLD trust in years. There were 1159.31 tonnes of gold in GLD on 19-Jun-2020. This looks very bullish for gold.


donderdag 14 mei 2020

Stock Forecaster Index

The Stock Forecaster Index can predict the movement of stocks and is based on the following parameters:
  • Fed balance sheet expansion
  • Credit spreads
  • Initial jobless claims


The Brave-Butters-Kelley index is leading the stock market.


Check the P/E Ratio. The lower the better.


Check the Buffett Rule. The lower the better.


Check the Euphoria.


Check the cycle.


Check leading indicators. U.S. leading indicators can be found here.


Foreign holdings of U.S. equities.


Yardeni's forecast can be found here.


Yardeni S&P500 earnings can be found here. Earnings per sector can be found here.  PE ratios can be found here for each country.


Watch the Put Call ratio for short term movements.


Stock valuation.


Check the Mannarino Index. Low index means low risk, High index means high risk.


The NAHB housing market index is leading the business cycle.


Real sales to private purchasers are a better measure for GDP.


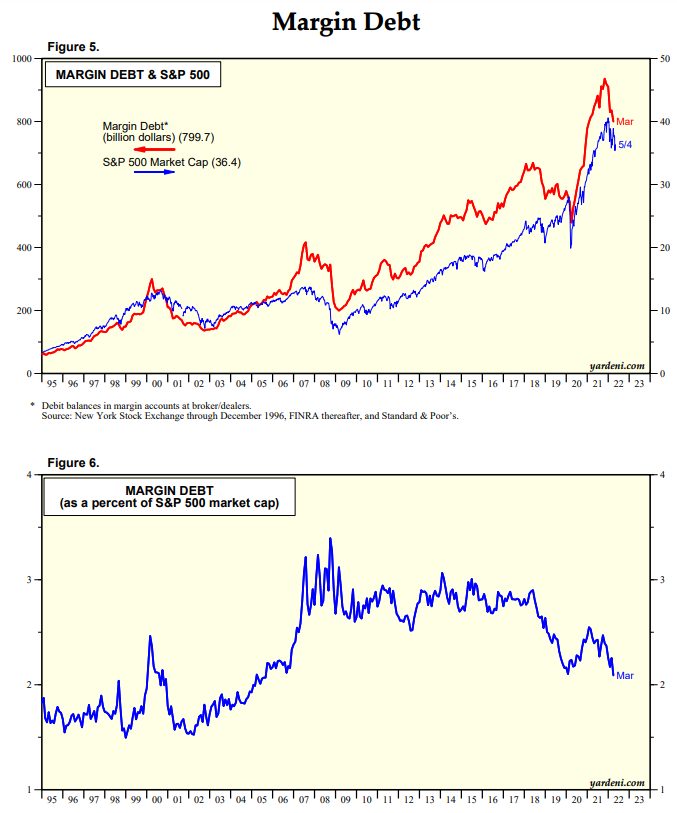
Margin accounts are a leading indicator.


CAPEX is a leading indicator for equity returns. 


The Black Swan Indicator tells us when to buy or sell stocks.


Check the Smart Money Flow Index, as it accurately predicts the future performance of the Dow Jones.


Know your cycle and track the recovery.


Check the housing market Redfin data for price drops pointing to a recession.
 

Another way to look at this is to calculate the annualized equity return based on this formula: (equity+debt)/market value of equity. The black line shows the annualized stock return that investors earned over the subsequent 10 years.


Equity allocation is inversely correlated to equity returns.


Market cap to gross value added ratio.


Part-time and over-time workers are a leading indicator for a recession as they are fired first.

Truck tonnage is correlated to stocks.


Corporate profits can be forecasted using government deficit and consumer savings numbers.

  
Since 2020, the central banks fully control the stock market via the formula:
Net liquidity = Fed Assets - TGA - Reverse Repo


Goods spending predicts recessions and unemployment rate.


Check bank tightening conditions.


Check building permits.


If they stop hiking rates, stocks will fall.


The Citigroup economic surprise index gives the risk of recession.


The near term forward spread is a predictor of a recession.


An inverted yield curve predicts recessions.


GDP converges on GDI. Watch the gap.


Home builder index XHB is a leading indicator for stocks.


Buy stocks when VIX is at 30, sell stocks when VIX is at 20.


Nenner cycle.

For more indicators go here.