dinsdag 28 februari 2023

Crude Oil in Transit Vs. Tanker Rates

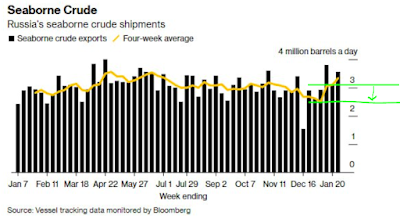
When there is a lot of oil in transit, you need tankers to store and transport the oil. 


maandag 20 februari 2023

Rig count Vs. Oil production

Rig count Vs. oil production. 


China Wind Installations

China is building a lot of wind mills. 


Baltic Dry Index Vs. China Steel Production

The largest segment of dry bulk (67%) is iron ore, grains and coal. Iron ore segment is in terminal decline. Don't count on grains either because China population is dropping now. Also don't count on coal because that will be phased out due to ESG.


zaterdag 18 februari 2023

vrijdag 17 februari 2023

Sprott Holdings Update

Sprott updated its holdings. 

Buys: Mainly gold names like i-80 gold corp, Anglogold, Mag Silver, Agnico, Vizsla.

Sells: Sold battery and graphite names. Decreased Newmont, Sandstorm and Kinross. Endeavour silver was dumped.


woensdag 15 februari 2023

IEA oil supply and demand

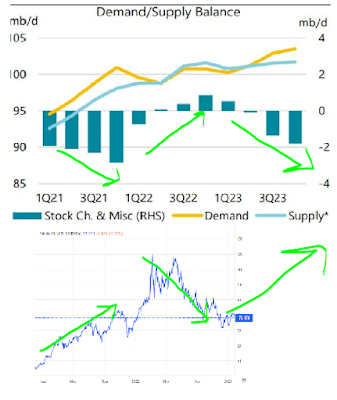
It's looking good for oil. 

The secretary general of the Organization of Petroleum Exporting Countries (OPEC) Haitham Al Ghais said oil demand is projected to rise further to reach 110 million barrels per day by 2025, according to Reuters.

15 February


15 March


maandag 6 februari 2023

Energy consumption Vs. GDP per capita

As India and China develop their economies, electricity consumption will increase. 


zondag 5 februari 2023

Margin Debt Vs. SP500

 Margin debt is pretty low. Chance of a crash is low.


Stock Forecaster Index (backup)

 The Stock Forecaster Index can predict the movement of stocks and is based on the following parameters:

  • Fed balance sheet expansion
  • Credit spreads
  • Initial jobless claims


The Brave-Butters-Kelley index is leading the stock market.


The Fed has its stock valuation model.


Yardeni's forecast can be found here.


Yardeni S&P500 earnings can be found here. PE ratios can be found here for each sector.


Watch the Put Call ratio for short term movements.


Check the Mannarino Index. Low index means low risk, High index means high risk.


The NAHB housing market index is leading the business cycle.


Margin accounts are a leading indicator.


CAPEX is a leading indicator for equity returns. 


The Black Swan Indicator tells us when to buy or sell stocks.


Check the Smart Money Flow Index, as it accurately predicts the future performance of the Dow Jones.


Know your cycle and track the recovery.


Check the housing market Redfin data for price drops pointing to a recession.
 

Another way to look at this is to calculate the annualized equity return based on this formula: (equity+debt)/market value of equity. The black line shows the annualized stock return that investors earned over the subsequent 10 years.


Equity allocation is inversely correlated to equity returns.


Part-time workers are a leading indicator for a recession as they are fired first.

Truck tonnage is correlated to stocks.


Corporate profits can be forecasted using government deficit and consumer savings numbers.

  
Since 2020, the central banks fully control the stock market via the formula:
Net liquidity = Fed Assets - TGA - Reverse Repo


Goods spending predicts recessions and unemployment rate.


The Citigroup economic surprise index gives the risk of recession.


Home builder index XHB is a leading indicator for stocks.


Buy stocks when VIX is at 30, sell stocks when VIX is at 20.


For more indicators go here.