To be able to time the precious metals market you need to take into account a lot of things. Here is a checklist.
1) Gold Forecaster Index
The gold forecaster index is a leading index for the gold price.
Always make sure that the gold forecaster index is in positive territory when buying gold/silver.
2) Taylor Rule Rate
Inflation starts to appear when the Taylor Rule Rate is above the Fed Funds rate. Only buy gold when the chart is in positive territory.
3) Misery Index
Another correlation is that between the misery index and gold. The more misery, the higher the gold price. High unemployment and high inflation are good for gold.
4) Real Output
Productivity is negatively correlated to inflation. Whenever productivity slows down, efficiency drops and goods become more expensive to make, resulting in higher inflation, which is good for gold.
5) Supply and Demand
Always check that gold and silver demand is higher than the supply of gold and silver. When mine supply goes down, precious metals typically move higher.
However,
be aware that gold has a high stock to flow ratio, which means mine production doesn't impact the gold price that much as it does with other commodities.
The
USGS gives annual numbers on silver production and silver reserves.
As silver is a byproduct of base metal mining, it is important to watch copper production in
Chile and
Peru.
6) Gold Demand
Gold demand can be witnessed from many places. Watch the
global ETF flows.
Watch the
GLD stock level. If the stock level goes higher, the price goes higher.
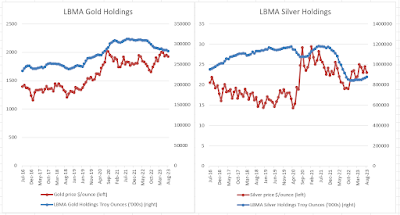
Watch
LBMA gold/silver levels.
China gold demand can be found from the
SGE deliveries. Make sure this number goes higher each month. India gold imports can be found
here.
7) Silver Demand
Silver demand can be witnessed from the
SLV stock level. If the stock level goes higher, the price goes higher.
SLV is correlated to the total physical silver holdings.
Watch the COMEX silver numbers. You want these to actually go down because that would mean there is a shortage.
It means that money is moving from COMEX to PSLV.
8) Central bank gold demand
Make sure to check if central banks are buying gold.
Central banks owned 1150 million ounces in reserves.
9) U.S. Mint Sales
10) Gold and Silver Premiums
Junk silver bags are primarily bought for their silver content and follow spot silver prices very closely. If you see a spike in premiums here, that means there is real demand for silver.
Shanghai gold premiums can be found
here.
Shanghai silver premiums are rising.
The
COT report gives info on open interest, swaps and managed money. You want to see a lot of managed money shorts, which will result in a short squeeze. You want to see the swap dealers being long the market (positive swap number). Open interest is correlated to the gold price.
The following chart shows that swap dealers move opposite of the gold price.
12) Backwardation
Make sure to buy gold when there is backwardation. That means there is an accute supply problem. You want a
negative GOFO rate.
Gold Forward Rate GOFO = LIBOR - Gold Lease Rate GLR
Moreover, gold/silver bottoms out when the lease rate curve inverts.
13) Swiss Franc Vs. Gold
Watch the Swiss Franc for short term movements. A strong Swiss Franc is good for gold.
14) TIPS
Gold and TIPS are correlated.
15) Real Yields
Gold outperforms when real yields go down.
16) Seasonality
Gold/Silver is more likely to rise during the months of January, April, July, September and November.
17) Technicals
Besides all these fundamental reasons above, you need to check the technical picture as well. Buy gold when there is a breakout. (Jesse Livermore: "Follow the path of least resistance")
18) Cycles
20) Currency in circulation
Look at the big picture.
21) 30 year/10 year bond yield ratio
This ratio shows the market's expectation of inflation.
22) Google Trends
If Debt to GDP rises, gold rises.
24) Near Term Forward Spread
When rate hikes stop, gold rises and stocks fall.
26) OCC Report
27) FRBNY Foreign Gold Deposits
28) Bank Term Funding Program
If the regional banks fail, the bank term funding program rises. Deposits will flow out of the banks into gold.
Keep an eye on the secret second central bank of the U.S.: the
FHLB. If this spikes, trouble appears in the banking system.