As flat as a pancake.
- List of Correlations
- Gold Checklist
- Copper Checklist
- Gold Forecaster
- Oil Forecaster
- Stock Forecaster
- Bond Forecaster
- USD Forecaster
- Poo Forecaster
- Bitcoin Checklist
- Q Ratio
- Stock Valuation
- Leading/Coincident Indicator
- Misery Index
- Junk Bonds Vs. Stocks
- Currency Vs. Bonds
- Yield Curve Vs. Fed Funds Rate
- U.S. Bond Yields
- Dividend Yield Vs. Bond Yield
- QE Vs. Bond Yields
- Money Supply
- Dow Theory
- Excess Reserves
- Central Bank Balance Sheets
- Fed Balance Sheet Vs. Dow Jones
- Credit Spread Vs S&P
- Total credit Vs. Dow Jones
- Debt
- Debt Vs. Delinquency
- % Debt Held by Foreigners
- Interest Payment on Government Debt
- Disposable Income Vs. Housing
- Retail Sales Vs. Disposable Income
- Tax Revenue Vs. Stocks
- Tax Revenue Vs. Savings Rate
- NIIP Vs. Currency
- Trade Balance Vs. Currency
- Deficit
- Deficit to Outlay Ratio
- China Power Consumption Vs. China GDP
- Freight Vs. GDP
- Inventory Vs. GDP
- PCE Vs. GDP
- GDP Vs. Trade Balance
- GDP Vs. 10 Year Bond Yield
- GDP Vs. PMI
- Profits Vs. Employment
- Employment-Population Ratio Vs. Wages
- Employment-Population Ratio Vs. GDP per Capita
- Unemployment Vs. GDP
- Part-time Employment
- Productivity Vs. CPI
- Output Gap Vs. CPI
- Taylor Rule Rate Vs. Gold
- PPI/CPI/PCE
- Retail Sales Vs. CPI
- 2 Year Vs. LIBOR/SOFR Vs. Fed Funds Rate
- Loan Growth Vs. Fed Funds Rate
- Fed Funds Rate Vs. CPI
- Fed Funds Rate Vs. Unemployment
- Delinquencies Vs. Unemployment
- Delinquency Vs. Fed Funds Rate
- Labor Force Vs. Unemployment
- Non-Farm Payrolls Vs. Unemployment
- Quits Rate Vs. Wage Inflation
- Wage Inflation Vs. Unemployment
- Wage Inflation Vs. CPI
- M2 Vs. CPI
- Capacity Utilization Vs. CPI
- Capacity Utilization Vs. Unemployment
- New Homes Vs. Rents
- Lumber Vs. Housing
- Savings Vs. Housing
- Housing Starts Vs. Unemployment
- Initial Jobless Claims Vs. S&P
- Consumer Sentiment Vs. S&P
- Durable Goods Orders Vs. S&P
- Building Permit Vs. Housing
- Construction Vs. Housing
- Adjustable Mortgage Vs. Fed Funds Rate
- Fixed Mortgage Rates Vs. 30 Year Bond Yield
- MZM Vs. 10 Year Bond Yield
- Gold Vs. 10 Year Bond Yield
- Dow/Gold Ratio
- GOFO Vs. Gold
- Gold/Silver COMEX
Posts tonen met het label LME. Alle posts tonen
donderdag 10 juli 2025
vrijdag 10 juni 2022
Warehouse Stock Level Inventories of Commodities
Labels:
commodities,
inventories,
LME,
stock,
warehouse
dinsdag 27 april 2021
Copper Stock Level Vs. Copper Price
When copper warehouse stock levels go down, this indicates there is a shortage. Copper price goes up.
Capstone Mining reports the following warehouse levels.
Trafigura reports that copper stock levels are at all time lows. Seasonally speaking, copper stock levels should come down in the second half of the year.
The LME is the best way to monitor this as it is the largest warehouse.
vrijdag 23 mei 2014
LME copper stock hits multi-year low
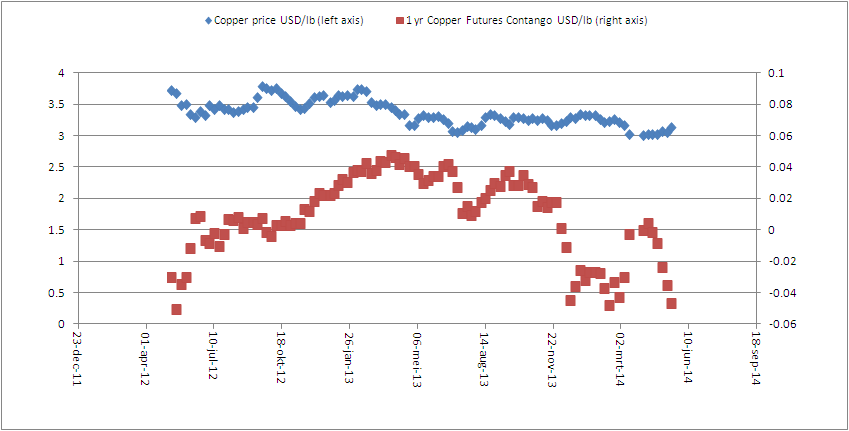
The latest numbers on the forward curve for copper show something interesting. Copper went from contango steeply into backwardation again in just a month (see chart below, created by Correlation Economics). This indicates price strength in copper.
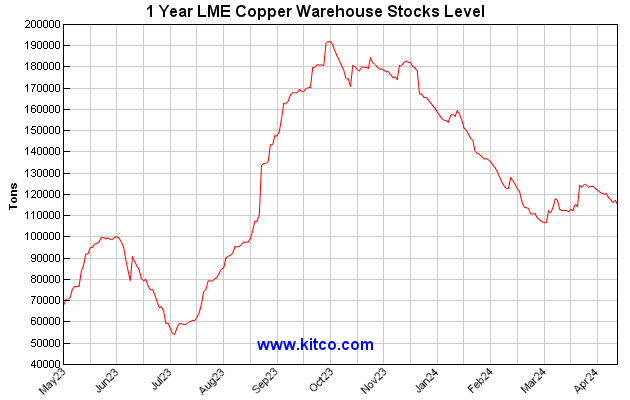
And consistent with our correlation between copper backwardation and LME stock levels, the LME stock level went down as well, hitting multi-year lows. We are hitting below the 200000 tonne level, never seen since 2008.
This indicates to me that there is a tight supply of copper. We may have a surplus in copper concentrate, but what is off the radar is the deficit in global refined copper. That deficit stands at approximately 600000 tonne this year. If this trend of backwardation widens in the coming months when LME stock levels hit critical low levels, copper could rise some more in price.
To read further, go here.
And consistent with our correlation between copper backwardation and LME stock levels, the LME stock level went down as well, hitting multi-year lows. We are hitting below the 200000 tonne level, never seen since 2008.
This indicates to me that there is a tight supply of copper. We may have a surplus in copper concentrate, but what is off the radar is the deficit in global refined copper. That deficit stands at approximately 600000 tonne this year. If this trend of backwardation widens in the coming months when LME stock levels hit critical low levels, copper could rise some more in price.
To read further, go here.
Labels:
backwardation,
China,
copper,
LME,
stock
dinsdag 19 november 2013
What do new rules at LME mean for metal prices?
Weeble posted an interesting question, which I don't know the answer to, but I can guess:
So basically the LME shortens the warehousing queues by decreasing waiting time duration to 100 days (July 2013) and now to 50 days (November 2013). Beginning from April next year.
I'm not an expert on LME warehousing. But what I've read is that traders think it will make prices of commodities go down, because all that supply goes into the market and it would become less attractive for warehousing companies to bid for metal. On the other hand, this change in plans means lower warehouse levels and that will make delivery more difficult. There will be delays. What if there is a sudden demand in copper in China while warehouse levels are lower and what if dealers need to deliver on the expiring short positions. We will see backwardation. As a matter of fact, backwardation is correlated with LME copper levels as shown below.
You can see that LME copper levels go up and down (Chart 1) in striking similarity with the copper contango curve (Chart 2: red graph). It's too early to make conclusions though...
And as you know from the copper contango theory, if copper goes into backwardation, the copper price will go up. So a lower LME warehouse level due to the new rules at the LME, will result in higher copper prices. That's my guess.
Remember what we had in the nickel market. We almost had a nickel default at the LME in 2006.
And what happened when nickel was at record low stock levels? The nickel price soared afterwards.
Everything points to higher prices in my opinion.
Albert, I always find your blog very educational.
I am interested in what you think of the following. It seems to me to be a big deal but nobody is commenting on it. Will it cause more bullion to come in to the market short term or will the increase in transparency show the weakness in the system? Thanks.
http://uk.reuters.com/article/2013/11/07/uk-lme-warehouses-idUKBRE9A611O20131107
So basically the LME shortens the warehousing queues by decreasing waiting time duration to 100 days (July 2013) and now to 50 days (November 2013). Beginning from April next year.
I'm not an expert on LME warehousing. But what I've read is that traders think it will make prices of commodities go down, because all that supply goes into the market and it would become less attractive for warehousing companies to bid for metal. On the other hand, this change in plans means lower warehouse levels and that will make delivery more difficult. There will be delays. What if there is a sudden demand in copper in China while warehouse levels are lower and what if dealers need to deliver on the expiring short positions. We will see backwardation. As a matter of fact, backwardation is correlated with LME copper levels as shown below.
You can see that LME copper levels go up and down (Chart 1) in striking similarity with the copper contango curve (Chart 2: red graph). It's too early to make conclusions though...
| Chart 1: Copper Warehouse Stocks Level |
| Chart 2: Copper Contango Theory |
Remember what we had in the nickel market. We almost had a nickel default at the LME in 2006.
Excerpts from the LME’s press release of August 16, 2006:
Those with short positions in nickel falling prompt on Friday 18 August 2006, and on subsequent prompt dates until further notice, who are unable to effect physical delivery an/or unable to borrow metal at a backwardation of no more than $300.00 per tonne per day, shall be able to defer delivery for a day at a penalty of $300.00 per tonne. Those with long positions for prompt on those days who are subject to deferred delivery shall be entitled to compensation of $300.00 per tonne per day
And what happened when nickel was at record low stock levels? The nickel price soared afterwards.
| Chart 3: Nickel stock levels Vs. Nickel Price |
Labels:
backwardation,
copper,
correlation,
default,
LME,
metal,
nickel,
prices,
stock
woensdag 20 juni 2012
China Buys Out London's Crown Jewel
As China becomes more and more a leader in the global economy it is not only purchasing the largest amounts of commodities, but is also starting to buy up strategic assets. This time China bought a legacy of 135 year, right in the heart of London.
Over this weekend (16 June 2012), China bought out the London Metal Exchange (LME) for 1.38 billion pounds. This means that J.P. Morgan, Goldman Sachs and Metdist are giving up on their shares of the LME. The LME is now part of the Hong Kong Exchange (HKEx).
This event will increase China's monetary flexibility on the base metals front. It is an important addition to China's assets because China is the largest consumer of commodities in the world. The LME isn't a small exchange as it has an 80% share in global futures trading in key base metals like aluminum, copper and zinc. The plans for China with the LME acquisition is to incorporate more Chinese companies on the exchange and to introduce Chinese currency based contracts trading. It will also enable China to use local warehouses for their customers as the warehouses in China are already over capacity (see my previous article about copper in Chinese warehouses in Shanghai).
It is interesting to note that there were other bidders for the LME, namely the CME and NYSE, but they couldn't compete against the Hong Kong Exchange. The LME only makes about 10 million pounds a year in profit, while the buy out price is at 1.38 billion pounds. That's a multiple of 138! Nobody would buy a company with a P/E ratio of 138, but China did. If we look at another metric (trailing net income), China actually bought the LME at a price of 180 times trailing net income, which is the most expensive deal since 2000. This is because the LME has a lot of strategic value in it for China. One of the most important values is that China now can set the pricing and warehousing of commodities around the world. This is because the LME has 732 approved storage facilities in 37 locations in 14 countries from Singapore to the U.S. This fits perfectly with their strategy in becoming the largest commodity consumer in the world.
Following this highly dilutive transaction by the Hong Kong Exchange, investors should first know that the earnings forecast of the HKEx isestimated to go down around 3-5%. Not only due to the high premium of the buyout of the LME, but also due to costs that will occur during the roll-out of the Asian platform to boost the LME's business in China.
Second, I expect that tariffs on contracts will be increased over time. This is because HKEx has the ambition to become the leading exchange platform in China, competing with the Shanghai Futures Exchange. However, the increase in tariffs will not occur before 2015 as confirmed by the HKEx.
Third, due to an inflow of new Chinese customers to the LME, China-related trading will start to increase. Currently, China-related trading volume on the LME stands at only 20%. This buyout event will enable countless Chinese businesses to start trading on the LME. Where in the past, Beijing had restricted Chinese domestic firms to trade on foreign exchanges. As a consequence, China can reduce delays, transit times, business costs and enhance commodity trade flows to China. In other words, China, who accounts for consumption of 40% of the world's commodities, will be able to acquire commodities at a faster pace in the future. It will also be able to start trading in other essential metals like iron ore and steel making coal. I believe this is bullish for commodities in general. Investors can bet on commodities through ETF's like the PowerShares DB Commodity Index Tracking Fund (DBC).
But the most important aspect is that China will have the power to create products on the LME that are denominated in yuan. This is again another step forward for China to compete agains the U.S. dollar as reserve currency of the world. Investors should take this opportunity to invest more of their money in RMB by buying funds that track the yuan, e.g. Market Vectors Chinese Renminbi/USD ETN (CNY).
Over this weekend (16 June 2012), China bought out the London Metal Exchange (LME) for 1.38 billion pounds. This means that J.P. Morgan, Goldman Sachs and Metdist are giving up on their shares of the LME. The LME is now part of the Hong Kong Exchange (HKEx).
This event will increase China's monetary flexibility on the base metals front. It is an important addition to China's assets because China is the largest consumer of commodities in the world. The LME isn't a small exchange as it has an 80% share in global futures trading in key base metals like aluminum, copper and zinc. The plans for China with the LME acquisition is to incorporate more Chinese companies on the exchange and to introduce Chinese currency based contracts trading. It will also enable China to use local warehouses for their customers as the warehouses in China are already over capacity (see my previous article about copper in Chinese warehouses in Shanghai).
It is interesting to note that there were other bidders for the LME, namely the CME and NYSE, but they couldn't compete against the Hong Kong Exchange. The LME only makes about 10 million pounds a year in profit, while the buy out price is at 1.38 billion pounds. That's a multiple of 138! Nobody would buy a company with a P/E ratio of 138, but China did. If we look at another metric (trailing net income), China actually bought the LME at a price of 180 times trailing net income, which is the most expensive deal since 2000. This is because the LME has a lot of strategic value in it for China. One of the most important values is that China now can set the pricing and warehousing of commodities around the world. This is because the LME has 732 approved storage facilities in 37 locations in 14 countries from Singapore to the U.S. This fits perfectly with their strategy in becoming the largest commodity consumer in the world.
Following this highly dilutive transaction by the Hong Kong Exchange, investors should first know that the earnings forecast of the HKEx isestimated to go down around 3-5%. Not only due to the high premium of the buyout of the LME, but also due to costs that will occur during the roll-out of the Asian platform to boost the LME's business in China.
Second, I expect that tariffs on contracts will be increased over time. This is because HKEx has the ambition to become the leading exchange platform in China, competing with the Shanghai Futures Exchange. However, the increase in tariffs will not occur before 2015 as confirmed by the HKEx.
Third, due to an inflow of new Chinese customers to the LME, China-related trading will start to increase. Currently, China-related trading volume on the LME stands at only 20%. This buyout event will enable countless Chinese businesses to start trading on the LME. Where in the past, Beijing had restricted Chinese domestic firms to trade on foreign exchanges. As a consequence, China can reduce delays, transit times, business costs and enhance commodity trade flows to China. In other words, China, who accounts for consumption of 40% of the world's commodities, will be able to acquire commodities at a faster pace in the future. It will also be able to start trading in other essential metals like iron ore and steel making coal. I believe this is bullish for commodities in general. Investors can bet on commodities through ETF's like the PowerShares DB Commodity Index Tracking Fund (DBC).
But the most important aspect is that China will have the power to create products on the LME that are denominated in yuan. This is again another step forward for China to compete agains the U.S. dollar as reserve currency of the world. Investors should take this opportunity to invest more of their money in RMB by buying funds that track the yuan, e.g. Market Vectors Chinese Renminbi/USD ETN (CNY).
Labels:
China,
exchange,
Goldman Sachs,
J.P. Morgan,
LME,
london,
metal,
Metdist
zondag 6 mei 2012
Copper turns to backwardation, prices poised to rise
I have been monitoring the copper warehouse stock levels in previous articles and today I came across an interesting article on Seekingalpha talking about copper futures contango. In that article the author gave a historical chart of the premium or discount for contracts extending about a year to 18 months in the future.
We will see that backwardation will have a positive effect on copper prices and much more. The Chinese have been doing very odd things with their copper warehouse stocks.
To read about this go to: Copper turns to backwardation.
Labels:
backwardation,
China,
copper,
LME
zondag 8 april 2012
Copper Inventories Rising
With the China PMI indicating a contraction in GDP growth (of which I talked about HERE), another sign has emerged of China slowing down.
The LME Copper Warehouse Stocks Level has started a trend change and is actually rising (Chart 1). This build in inventories is probably indicating a slowing down the economy. A part of this build is due to Chinese markets staying shut for a public holiday on Wednesday 4 April 2012: Qing Ming Festival (清明节). Shanghai reopened on Thursday.
To see my analysis on this trend change go to Copper Demand and the Importance of China.
zaterdag 10 maart 2012
China: Turning US Treasuries Into Hard Assets
A month ago I indicated in this article that China is massively buying copper. It seems that this trend hasn't stopped yet, and it won't stop anytime soon. The LME copper warehouse stocks level has been trending down since late last year (Chart 1), which incidentally coincided with China decreasing its margin requirements on banks, which I discussed in this article.
Today, China posted one of the largest deficits in their history, to see why this is, go to: China converting US treasuries into hard assets.
Labels:
balance of trade,
China,
commodities,
copper,
deficit,
export,
import,
Iron,
LME,
Natural gas,
oil,
Russia,
US treasuries,
zinc
zaterdag 28 januari 2012
Chinese buying copper
At the London Metal Exchange (LME) the copper stock levels keep declining as can be seen on following graph:
The Chinese were importing copper at record levels during December 2011 to restock their inventory. There has been a concern that in 2012, there will be a copper deficit, which resulted into this buying frenzy.
![]() |
| LME Copper warehouse level |
As a result we can see that since September 2011 the copper price was going up, just at the same time that LME stock levels were going down.
I can't blame the Chinese to buy copper, they want real assets and not some US government paper, which they are dumping by the way as can be seen on following graph:
I think the buying frenzy is not over yet, as China is positioning itself to create competition against the London Metals Exchange in June 2012. On that date China will open the Pan Asia Gold Exchange, also known as PAGE, challenging the LME and COMEX.
I predict that gold and silver will explode on that event. Interesting times will emerge later in 2012, so prepare accordingly by buying precious metals!
![]() |
| Copper price |
![]() |
| China US treasury holdings |
I think the buying frenzy is not over yet, as China is positioning itself to create competition against the London Metals Exchange in June 2012. On that date China will open the Pan Asia Gold Exchange, also known as PAGE, challenging the LME and COMEX.
I predict that gold and silver will explode on that event. Interesting times will emerge later in 2012, so prepare accordingly by buying precious metals!
Abonneren op:
Posts (Atom)