Food prices will not come down until production rises.
- List of Correlations
- Gold Checklist
- Copper Checklist
- Gold Forecaster
- Oil Forecaster
- Stock Forecaster
- Bond Forecaster
- USD Forecaster
- Poo Forecaster
- Bitcoin Checklist
- Q Ratio
- Stock Valuation
- Leading/Coincident Indicator
- Misery Index
- Junk Bonds Vs. Stocks
- Currency Vs. Bonds
- Yield Curve Vs. Fed Funds Rate
- U.S. Bond Yields
- Dividend Yield Vs. Bond Yield
- QE Vs. Bond Yields
- Money Supply
- Dow Theory
- Excess Reserves
- Central Bank Balance Sheets
- Fed Balance Sheet Vs. Dow Jones
- Credit Spread Vs S&P
- Total credit Vs. Dow Jones
- Debt
- Debt Vs. Delinquency
- % Debt Held by Foreigners
- Interest Payment on Government Debt
- Disposable Income Vs. Housing
- Retail Sales Vs. Disposable Income
- Tax Revenue Vs. Stocks
- Tax Revenue Vs. Savings Rate
- NIIP Vs. Currency
- Trade Balance Vs. Currency
- Deficit
- Deficit to Outlay Ratio
- China Power Consumption Vs. China GDP
- Freight Vs. GDP
- Inventory Vs. GDP
- PCE Vs. GDP
- GDP Vs. Trade Balance
- GDP Vs. 10 Year Bond Yield
- GDP Vs. PMI
- Profits Vs. Employment
- Employment-Population Ratio Vs. Wages
- Employment-Population Ratio Vs. GDP per Capita
- Unemployment Vs. GDP
- Part-time Employment
- Productivity Vs. CPI
- Output Gap Vs. CPI
- Taylor Rule Rate Vs. Gold
- PPI/CPI/PCE
- Retail Sales Vs. CPI
- 2 Year Vs. LIBOR/SOFR Vs. Fed Funds Rate
- Loan Growth Vs. Fed Funds Rate
- Fed Funds Rate Vs. CPI
- Fed Funds Rate Vs. Unemployment
- Delinquencies Vs. Unemployment
- Delinquency Vs. Fed Funds Rate
- Labor Force Vs. Unemployment
- Non-Farm Payrolls Vs. Unemployment
- Quits Rate Vs. Wage Inflation
- Wage Inflation Vs. Unemployment
- Wage Inflation Vs. CPI
- M2 Vs. CPI
- Capacity Utilization Vs. CPI
- Capacity Utilization Vs. Unemployment
- New Homes Vs. Rents
- Lumber Vs. Housing
- Savings Vs. Housing
- Housing Starts Vs. Unemployment
- Initial Jobless Claims Vs. S&P
- Consumer Sentiment Vs. S&P
- Durable Goods Orders Vs. S&P
- Building Permit Vs. Housing
- Construction Vs. Housing
- Adjustable Mortgage Vs. Fed Funds Rate
- Fixed Mortgage Rates Vs. 30 Year Bond Yield
- MZM Vs. 10 Year Bond Yield
- Gold Vs. 10 Year Bond Yield
- Dow/Gold Ratio
- GOFO Vs. Gold
- Gold/Silver COMEX
Posts tonen met het label prices. Alle posts tonen
zondag 19 juni 2022
woensdag 20 oktober 2021
Car prices skyrocketing
When nobody produces cars (due to chip and aluminum/magnesium shortages), then car prices move higher.
maandag 9 augustus 2021
woensdag 7 juli 2021
Peter Schiff Describes The Gap in Import Export Prices
Lately, the import prices have surged, while export prices still sit at the same level. Peter Schiff explains that import prices are up because U.S.A. is printing so much money. All of that money is trying to buy stuff overseas, but since there is no stuff to buy anymore, prices will need to go up. This is not a problem of "shortage", it is a problem of an abundance of dollars.
There are no inventories left, while everyone is buying stuff.
dinsdag 19 november 2013
What do new rules at LME mean for metal prices?
Weeble posted an interesting question, which I don't know the answer to, but I can guess:
So basically the LME shortens the warehousing queues by decreasing waiting time duration to 100 days (July 2013) and now to 50 days (November 2013). Beginning from April next year.
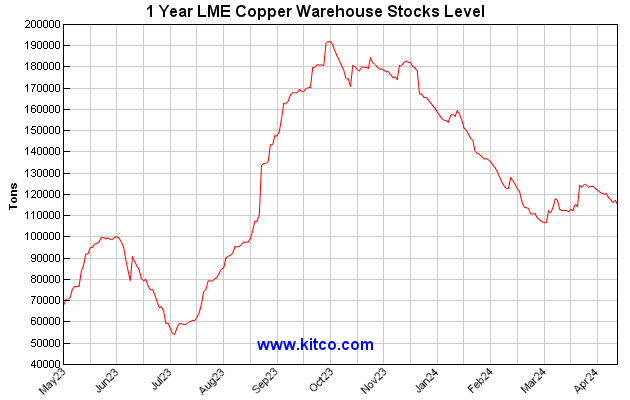
I'm not an expert on LME warehousing. But what I've read is that traders think it will make prices of commodities go down, because all that supply goes into the market and it would become less attractive for warehousing companies to bid for metal. On the other hand, this change in plans means lower warehouse levels and that will make delivery more difficult. There will be delays. What if there is a sudden demand in copper in China while warehouse levels are lower and what if dealers need to deliver on the expiring short positions. We will see backwardation. As a matter of fact, backwardation is correlated with LME copper levels as shown below.
You can see that LME copper levels go up and down (Chart 1) in striking similarity with the copper contango curve (Chart 2: red graph). It's too early to make conclusions though...
And as you know from the copper contango theory, if copper goes into backwardation, the copper price will go up. So a lower LME warehouse level due to the new rules at the LME, will result in higher copper prices. That's my guess.
Remember what we had in the nickel market. We almost had a nickel default at the LME in 2006.
And what happened when nickel was at record low stock levels? The nickel price soared afterwards.
Everything points to higher prices in my opinion.
Albert, I always find your blog very educational.
I am interested in what you think of the following. It seems to me to be a big deal but nobody is commenting on it. Will it cause more bullion to come in to the market short term or will the increase in transparency show the weakness in the system? Thanks.
http://uk.reuters.com/article/2013/11/07/uk-lme-warehouses-idUKBRE9A611O20131107
So basically the LME shortens the warehousing queues by decreasing waiting time duration to 100 days (July 2013) and now to 50 days (November 2013). Beginning from April next year.
I'm not an expert on LME warehousing. But what I've read is that traders think it will make prices of commodities go down, because all that supply goes into the market and it would become less attractive for warehousing companies to bid for metal. On the other hand, this change in plans means lower warehouse levels and that will make delivery more difficult. There will be delays. What if there is a sudden demand in copper in China while warehouse levels are lower and what if dealers need to deliver on the expiring short positions. We will see backwardation. As a matter of fact, backwardation is correlated with LME copper levels as shown below.
You can see that LME copper levels go up and down (Chart 1) in striking similarity with the copper contango curve (Chart 2: red graph). It's too early to make conclusions though...
| Chart 1: Copper Warehouse Stocks Level |
| Chart 2: Copper Contango Theory |
Remember what we had in the nickel market. We almost had a nickel default at the LME in 2006.
Excerpts from the LME’s press release of August 16, 2006:
Those with short positions in nickel falling prompt on Friday 18 August 2006, and on subsequent prompt dates until further notice, who are unable to effect physical delivery an/or unable to borrow metal at a backwardation of no more than $300.00 per tonne per day, shall be able to defer delivery for a day at a penalty of $300.00 per tonne. Those with long positions for prompt on those days who are subject to deferred delivery shall be entitled to compensation of $300.00 per tonne per day
And what happened when nickel was at record low stock levels? The nickel price soared afterwards.
| Chart 3: Nickel stock levels Vs. Nickel Price |
Labels:
backwardation,
copper,
correlation,
default,
LME,
metal,
nickel,
prices,
stock
dinsdag 10 januari 2012
Belgium housing bubble
The Economist has a nice interactive tool to monitor the house prices from 1975 till 2012: http://www.economist.com/node/21009954
A few interesting observations can be made:
Belgium, where I'm living, is still in an upward trend in housing prices (Chart 1), while this can't be sustainable if we look at house prices against average income (Chart 2). Historically housing prices can only go up when wages go up, because you can't buy a house when you don't earn enough money to buy it/pay it off. I am expecting a similar drop in housing prices in Belgium like what has happened in the US in 2008.
In the United States, we see the collapse starting in 2007 and bottoming out in 2009.
In Japan, we see that house prices are becoming really cheap for Japanese people to buy, which is actually a good thing.
In Hong Kong we also seem to have a housing bubble forming.
Chart 1: House prices in real terms
Abonneren op:
Posts (Atom)


