Posts tonen met het label PMI. Alle posts tonen

zaterdag 27 april 2024

Flash PMI S&P Global Vs. Unemployment Rate

The flash PMI from S&P Global gives a leading indicator for the U.S. unemployment rate.


vrijdag 21 februari 2020

U.S. PMI Crashing

Falling bond yields have been signaling that GDP is going to crash along with the PMI.


woensdag 13 november 2019

QE Vs. Manufacturing PMI

Marko Kolanovich of JPM has a nice chart where he shows that QE is a leading indicator for PMI with a 6 month lead. So if you know that the Fed, the ECB, BOJ, PBOC are going to print money into next year 2020, you should know that the PMI will go up. This will boost GDP and the stock market in 2020.


woensdag 2 oktober 2019

ISM Manufacturing PMI Contraction

The ISM U.S. manufacturing purchasing managers’ index came in at 47.8% in September, the lowest since June 2009. So tariffs were supposed to bring back manufacturing jobs huh?


Considering the fact that 60% of U.S. exports is manufacturing. This will have a detrimental effect on the trade deficit and the U.S. dollar.


Also, while manufacturing is contracting, debt keeps piling up. We just got another 100 billion in debt added.


maandag 23 september 2019

woensdag 4 september 2019

Hong Kong goes into recession

Hong Kong is destroying itself with its protests.


ISM Manufacturing Contraction

The economy is not doing well. GDP growth will go lower. Bond yields will go lower. Yield curve will keep inverting.


woensdag 31 juli 2019

Chicago PMI Crashes, Clear Sign of Recession

If you've been following my correlations, a PMI below 50 means that GDP growth is going down.


vrijdag 28 juni 2019

donderdag 3 december 2015

ISM Manufacturing PMI Vs. ISM Services PMI

It's not so clear why, but the ISM Manufacturing PMI leads the ISM Services PMI. This means that the ISM Manufacturing PMI is more important as a leading indicator.


woensdag 26 juni 2013

GDP revised lower

As I suspected here, declining PMI will always result in lower GDP forecasts and "unexpected" revisions downward.


GDP growth was going to be 2.4% on an annual rate, now it is only 1.8% in Q1 2013.

This also means that the Zero Hour Debt chart is on track to go to zero.


More weakness is coming ahead of us as interest rates and mortgage rates go up. 


dinsdag 4 juni 2013

Correlation: S&P Revenues Vs. PMI

Dr. Ed Yardeni's blog is a pool full of critical information and one of them is a newly discovered correlation which I will add to my collection.

Apparently the PMI is a leading indicator for the S&P revenues, which also means the PMI is a leading indicator for the overall direction of the stock market. This is consistent with the correlation between the PMI and the GDP, which is correlated to the total stock market index on itself via the Warren Buffet Rule.

So if you want to know the direction of the earnings of the financials, just look at the PMI and you can predict the trend, which is certainly down after the miss in PMI reported the previous week.
Chart 1: S&P 500 Revenues Vs. PMI

maandag 3 juni 2013

Manufacturing PMI goes into Recession/Depression Territory

Look at that => Blue Chart. 

Yes, we crossed below zero for the PMI. Do you really think GDP growth will still go up?

Three words: Not A Chance...


dinsdag 30 april 2013

U.S. GDP Growth Slowing Down, Sell Stocks

The Chicago PMI just went in contraction from 52.5 to 49.0. This confirms all the bad news we already had in the previous months.

I expect that with this lower PMI, the ISM manufacturing PMI composite index (NAPM) will go down too.


And with that drop, the GDP growth will most certainly drop too. I would be very cautious if you are still buying stocks, thinking it will go higher.


zaterdag 20 april 2013

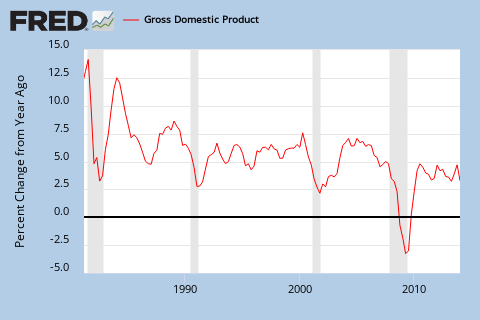
GDP Vs. PMI

This page is created to monitor the Gross Domestic Product (GDP) Vs. ISM Purchasing Manager Index (PMI). 

When the PMI declines (blue chart), the GDP growth rate (red chart) declines.


Industrial production numbers can be used to monitor the manufacturing PMI.

maandag 8 april 2013

GDP Growth to be Flat Going Forward

This chart says it all. We got a new data point and we see a sharp decline in PMI numbers. So I expect the red GDP curve to go down as well. Prepare yourself.
Chart 1: GDP Vs. PMI

maandag 1 april 2013

PMI numbers suggest correction in the U.S. stock market

We just got new PMI numbers for the U.S. and it isn't pretty. We dropped from 54 to 51. That also means that GDP will likely not grow. And that also means that the U.S. stock market is in for a correction.

Chart 1: PMI Vs. GDP
Because the Warren Buffett rule is, the stock market can't go much higher than the GNP. GNP is at 16.1 trillion, the total stock market index is at 16.3 trillion. This means: overvalued.

I say get out of U.S. stocks.