Posts tonen met het label zero. Alle posts tonen

woensdag 3 juli 2013

Correlation: Mortgage Rates Vs. Mortgage Applications Vs. Pending Home Sales

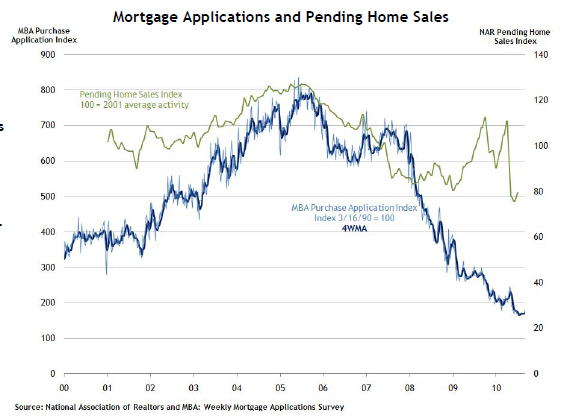
Just discovered another correlation on Zero Hedge. If mortgage rates go up, lending becomes more difficult, so people stop applying for new mortgages. This means there is a negative correlation between mortgage rates and mortgage applications.


When mortgage applications go down, not a lot of homes will be sold. This means that home sales will go down. As suggested by the following chart, there is a correlation here between mortgage applications and pending home sales. In fact, mortgage rates/mortgage applications are a leading indicator for pending home sales as presented in this Zerohedge article.

If it's true that interest rates and mortgage rates will go up, you can bet that we will have another housing crisis. Home sales go down. All those homes will be coming onto the market, while nobody wants them.

woensdag 26 juni 2013

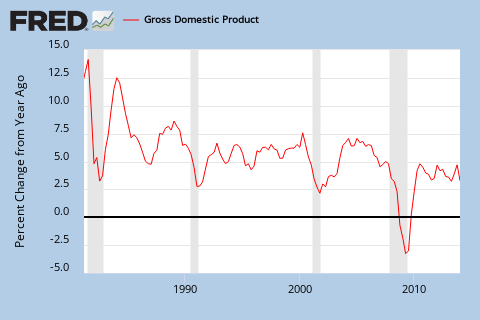
GDP revised lower

As I suspected here, declining PMI will always result in lower GDP forecasts and "unexpected" revisions downward.


GDP growth was going to be 2.4% on an annual rate, now it is only 1.8% in Q1 2013.

This also means that the Zero Hour Debt chart is on track to go to zero.


More weakness is coming ahead of us as interest rates and mortgage rates go up. 


vrijdag 26 april 2013

GDP Misses Expectations

The 2013 Q1 real GDP was weaker than expected. 2.5% year over year instead of 3.2%. With a miss in expectations, be prepared for lower stock markets as we are due for a correction. We are overvalued for sure.

But actually the number is pretty good. the GDP growth to debt growth ratio has inched up since the last release (Chart 1). Nominal GDP grew 1% from a quarter ago, while debt grew 2.4% in the same period.
Chart 1: Zero Hour Debt

zaterdag 20 april 2013

Money Velocity Vs. Bond Yield

This page is created to monitor the Money Zero Maturity Velocity (MZM velocity) Vs. 10 Year U.S. Treasuries.

Historically, both are correlated. If money velocity picks up (blue chart), 10 Year U.S. Treasury Yields will rise (red chart).


woensdag 30 januari 2013

Zero Hour Debt Has Arrived

As I have warned investors a few months ago on the "Zero Hour Debt" problem here on July 2012, today we find out that GDP has actually reached the 0% growth rate while the debt growth is increasing at an enormous pace. Real GDP in the U.S. has decreased 0.1% in the fourth quarter of 2012 to a mere $15.8 trillion while debt has grown 2.4% to $16.4 trillion.

As you can see on Chart 1, the ratio between nominal GDP Growth and Total National Debt Growth has touched the zero line, which means that additional debt growth is not stimulating the economy anymore. We really are reaching the end game here and will see a parabolic increase in debt.

Chart 1: Nominal GDP Growth to Total National Debt Growth Ratio

To read the analysis, go here.

vrijdag 26 oktober 2012

GDP Numbers are Out for Q3 2012

I'm always excited when I get another data point for my zero hour debt chart. Today the GDP numbers were out for Q3 2012. The media is all positive about the 2% growth in GDP year over year, but we all know 2% is not a positive number. Nowhere in that article they mention the debt growth, GDP growth is meaningless when debt grows faster than GDP. I wrote about zero hour debt here.

We can see now, that our newest data point is right in line with our trendline.

During the 3rd quarter, GDP rose 1% from $15.6 trillion to $15.78 trillion (quarter over quarter). But the debt rose 2% from $15.7 trillion to $16.1 trillion (quarter over quarter). That's double the GDP growth!

Make your own conclusions...

Chart 1: Zero Hour Debt