Posts tonen met het label correlations. Alle posts tonen

vrijdag 9 oktober 2020

List of All Correlations

Once in a while I need to post an update on all discovered correlations, we're getting a huge list already. If I only had some software to get automatic updates of these charts...


Positive correlations mean that if one goes up, the other goes up too. Negative correlations mean that if one goes up, the other goes down.

Positive correlations:
1) Silver/Gold premium Vs. Silver/Gold Price  (link 2)
2) Baltic Dry Vs. Industrial Commodities
3) Baltic Dry Vs. Copper
4) Copper Vs. S&P
5) Oil Vs. Dow Jones
6) Agriculture Price Vs. Health of Economy
7) Agriculture Vs. Fertilizer Price 
8) CRB Index Vs. Commodity prices (oil, agriculture, metals)
9) MZM velocity Vs. Inflation
10) MZM velocity Vs. 10 year U.S. treasury yield
11) Case-Shiller Index Vs. Housing Market Index
12) Capacity Utilization Vs. Inflation
13) Rhodium Price Vs. Automotive Industry
14) Housing Price Vs. Rise of Wages
15) O-metrix Score Vs. Stock Value
16) Outlay Spending Vs. Hyperinflation
17) Gold Money Index Vs. Gold Price
18) Stock Dividend to Bond Yield ratio Vs. Stock Price
19) War Vs. Silver Price
20) Exchange Rate Vs. Treasury Bond Valuation
21) PMI Vs. GDP Growth Rate
22) Gold Lease Rate Vs. Gold Price (link2) (link3) (link4)
23) Economy of Australia/Canada Vs. Industrial Commodities
24) Jim Sinclair's Fed Custodials Vs. Gold Price
25) LCNS silver net short positions Vs. Silver Price
26) ECB Deposit Rate Vs. Euribor and Deposit Facility (Deposit ECB)
27) China Gold Imports from Hong Kong Vs. Gold Price
28) AUD/USD Vs. Iron Ore
29) Chinese yoy GDP growth Vs. Chinese yoy Power Consumption (link 2)
30) Chinese yoy Power Consumption Vs. Chinese yoy Power Production
31) M1 and Gold
32) Obesity Vs. Debt
33) Global Equity Prices Vs. Global EPS revisions
34) Total Public Debt Vs. Interest Payment on Debt
35) U.S. Bond Yields Vs. Interest Payment on Debt
36) Federal Reserve Balance Sheet Vs. S&P
37) Federal Reserve Balance Sheet Vs. Gold Price
38) Balance Sheet Ratio Fed/ECB Vs. EUR/USD 
39) China Manufacturing PMI Vs. Base Metal Prices
40) COMEX stock level Vs. CFTC Open Interest
41) Manufacturing component of Industrial Production Vs. CRB Metals Index
42) Net Short Interest Gold Vs. Gold Price
43) Central Bank Net Gold Buying Vs. Gold Price
44) LCNS silver Vs. Silver Open Interest
45) Bond Yields Vs. Gold Price
46) Gold Miners Bullish Percent Index Vs. GDX
47) Daily Sentiment Index Gold Vs. Gold Price
48) Commercial Net Short Interest Vs. Silver Price
49) Food Stamp Participation Rate Vs. Unemployment Rate
50) Bitcoin Price Vs. Gold Price
51) Credit Expansion Vs. Economic Health (second link)
52) Gold Volatility Vs. Gold Price
53) Total Stock Market Index Vs. GDP
54) Brent Crude Oil Vs. WTI Crude Oil
55) EPS revisions Vs. P/E Ratio
56) Citigroup Surprise Index (CESI) Vs. S&P 
57) EPS revisions Vs. S&P
58) Dow Theory: Dow Jones Transportation Average Vs. Dow Jones Industrial Average
59) Margin Balance Vs. S&P
60) Federal Debt Growth Vs. 10 Year Treasury Yields
61) Fed Funds Rate Vs. 10 Year Treasury Yields
62) Total Central Bank Balance Sheet Vs. Gold Price
63) Large Commercial Short in Copper Vs. Copper Price
64) Bond Yields (<3%) Vs. P/E Ratio
65) ECB Lending (LTRO) Vs. Deposits at Banks
66) Disposable Income Vs. Housing Prices
67) Fixed (conventional) Mortgage Rate Vs. Treasury Yields
68) Adjustable Mortgage Rate Vs. Federal Funds Rate
69) Silver Vs. Bitcoin
70) Open Interest Trend Vs. Price Trend
71) Wage Inflation Vs. Consumer Price Index (CPI)
72) Marginal Cost of Gold Suppliers Vs. Gold Price (link 2)
73) Durable Goods Orders Vs. S&P
74) Gold ETF Trust (GLD) Vs. Gold Price
75) PMI (leading indicator) Vs. S&P Revenues
76) Federal Funds Rate Vs. LIBOR Rate
77) Lumber Price (leading indicator) Vs. Housing
78) Building Permits (leading indicator) Vs. Housing
79) Pending Home Sales Vs. Mortgage Applications
80) Employment-Population Ratio Vs. Real GDP per Capita
81) Trade Surplus/Deficit (leading indicator) Vs. Currency Strength/Weakness
82) German Treasury Yields Vs. U.S. Treasury Yields
83) Consumer Sentiment Index (leading indicator) Vs. S&P 500
84) Bitcoin Price Vs. Bitcoin Users
85) Potemkin Rally Vs. Employment to Population Ratio
86) LME Copper Warehouse Stock Level Vs. Copper Contango
87) Art Price (leading indicator) Vs. CPI
88) Total Credit Market Debt Vs. Dow Jones
89) SGE gold deliveries (leading indicator) Vs. China Gold Imports from Hong Kong (link 2)
90) Retail Sales Vs. Disposable Personal Income Per Capita
91) CRB Index Vs. Emerging Markets
92) Non Farm Payrolls Vs. Job Hires
93) Currency Debasement Vs. High Yielding Assets (Carry Trade) 
94) Deposits over Loans: Excess Reserves 
95) Food Price (leading indicator) Vs. Potash Price 
100) Federal Funds Rate Vs. CPI 
101) Full-time Vs. Part-time Workers (Recession) 
102) GLD ETF Vs. COMEX Stock 
103) GDP Growth Rate Vs. 10 Year Bond Yield 
104) Depletion Curve Vs. Price Movement (silver, oil)
105) Managed Money Long and Short Positions (gold and silver) Vs. Gold and Silver Price (link)
106) GDP Vs. Trade Balance 
107) Smart Money Flow Index (leading indicator) Vs. Dow Jones 
108) Bank Deposits Vs. Deposit Rates 
109) GOFO rate Vs. Gold Price 
110) Federal Reserve Asset Purchases Vs. Bond Yields 
111) Currency Vs. Bonds 
112) Retail Sales (leading indicator) Vs. Consumer Price Index (CPI)
113) Stock Buyback Vs. S&P 
114) Yen USD/JPY Carry Trade Vs. Gold (link 2)
115) Yen USD/JPY Carry Trade Vs. Stocks 
116) Leading/Coincident/Lagging Indicator Vs. Recession 
117) Gold per Capita Vs. Income per Capita 
118) GLD ETF Stock Vs. Total U.S. ETF gold Stock
119) Gold Repatriation Vs. Recession 
120) Dividend Yield Vs. Bond Yield 
121) Misery Index Vs. Gold 
122) Palm Oil (leading indicator) Vs. Soybean Oil Vs. Crude Oil 
123) Junk Bonds Vs. Stock Market 
124) Junk Bonds Vs. Energy Junk Bonds Vs. Oil 
125) P/E Ratio Vs. M/O Age Ratio 
126) Tax Revenues Vs. Stock Markets 
127) Employment to Population Ratio (leading indicator) Vs. Wage Growth
128) Equity Valuation Vs. Q Ratio (James Tobin)
129) Chapwood Index Vs. CPI 
130) Working Age Population (15-24) Vs. CPI 
131) ISM Manufacturing PMI (leading indicator) Vs. ISM Services PMI 
132) Global FX Reserves Vs. Global Equities 
133) Corporate Loan Charge-Offs and Delinquencies Vs. Federal Funds Rate (leading indicator) 
134) Breadth Advance-Decline Line (leading indicator) Vs. Stocks
135) USD/CNY Vs. Crude Oil
136) USD/CNY (leading indicator) Vs. S&P 
137) Corporate Profits (leading indicator) Vs. Employment 
138) Debt to GDP (leading indicator) Vs. Default Rate 
139) African Rand Vs. Silver 
140) GDP Output Gap (leading indicator) Vs. Inflation 
141) Yield Curve (leading indicator) Vs. Coincident Indicator 
142) GDP (leading indicator) Vs. Oil 
143) Credit Risk: LIBOR (leading indicator) Vs. Fed Funds Rate
144) Cross-Asset Correlation Vs. Gold 
145) Quits Rate (leading indicator) Vs. Wage Inflation 
146) Rig Count (leading indicator) Vs. Oil Production
147) U.S. Dollar Liquidity Vs. Emerging Market Stocks 
148) Loan Growth Vs. Interest Rates
149) Copper/Gold Ratio Vs. 10 Year Bond Yield 
150) Bond Yields Vs. Unrealized Losses Federal Reserve   
151) Trade War Vs. Inflation Vs. GDP
152) Gold/Silver Minus Oil Vs. HUI 
153) Silver Depletion Vs. Silver Production
154) Yield Curve Vs. Net Interest Margin 
155) PPI (leading indicator) Vs. CPI 
156) LIBOR Vs. Jumbo CD  
157) Initial Jobless Claims (leading indicator) Vs. Unemployment Rate 
158) Yield Curve Vs. Net Interest Margin 
159) 3-2 Year Yield (leading indicator) Vs. 2-1 Year Yield
160) Open Interest Vs. Gold Price 
161) 2 Year Yield (leading indicator) Vs. Fed Funds Rate  
162) Gold Vs. Negative Yielding Debt
163) AAA Credit Spread (leading indicator) Vs. Real GDP 
164) Maturity of Debt Vs. Debt to GDP 
165) SHFE Silver Warehouse (leading indicator) Vs. Silver Price 
166) Freights Vs. Real GDP 
167) PSLV Vs. Silver Price
168) Chinese Yuan Vs. Chinese Foreign Exchange Reserves 
169) OECD Leading Index (leading indicator) Vs. S&P Revenue 
170) China Credit Impulse (leading indicator) Vs. China GDP 
171) Credit Card Interest Rate Vs. 10 Year Bond Yield 
172) SOFR Vs. LIBOR  
173) QE Vs. Yield Curve
174) Suicide Rate Vs. Unemployment Rate 
175) Germany IFO Index (leading indicator) Vs. Germany GDP
176) Chinese Yuan Vs. China Errors and Omissions in Balance of Payments
177) NVT/RVT Vs. Bitcoin 
178) Yardeni FSMI Vs. S&P
179) Gold Open Interest Vs. Gold Price
180) QE (leading indicator) Vs. PMI 
181) Monetary Base/Money Supply Vs. Gold Reserves 
182) China GDP Vs. Gold Price
183) New Home Price (leading indicator) Vs. Rent CPI 
184) Delinquencies (leading indicator) Vs. Unemployment Rate 
185) Taylor Rule Rate (leading indicator) Vs. Gold Price 
186) Commercial Paper Rates Vs. Repo 
187) Cass Freight Index Vs. Real GDP 
188) PCE Vs. CPI 
189) Profits Before Tax (leading indicator) Vs. Stock Market 
190) Disposable Income Vs. Housing 
191) VIX Vs. Margin Debt Gold Selling
192) LBMA Spot Gold/Silver Vs. COMEX Gold/Silver Futures 
193) Net International Investment Position (NIIP) Vs. Current Account 
194) Debt to GDP Vs. Stagflation 
195) Air Traffic Vs. Oil Vs. Stocks 
196) Air Freight Vs. Trade Balance  
197) Conceptions Vs. GDP
198) Mexican Peso Vs. Silver Price
199) PCE Vs. GDP
200) AUD (leading indicator) Vs. CNY
201) Gold Miner Hedging Vs. Gold Lease Rate
202) Budget Deficit Vs. Gold Price
203) Backwardation in Lease Rate (leading indicator) Vs. Silver Price
204) Silver Margin Hike Vs. Silver Volatility
205) COMEX Deliveries Vs. Gold Price
206) Rhodium (leading indicator) Vs. Palladium
209) GDP Vs. Net Energy Delivered (Thermodynamic Oil Collapse)

Negative correlations:
1) Copper Price Vs. Copper Futures Contango
2) Interest Rates (bond yields >3%) Vs. P/E ratio of gold mines
3) Non-Farm Payrolls Vs. Unemployment Rate
4) Federal Debt Held by Foreigners Vs. U.S. Bond Yields
5) Size of Governments Vs. Their Economies
6) Stocks Vs. U.S. Dollar
7) Silver Stock at CME Vs. Silver Price
8) China Reserve Requirements Vs. Shanghai Real Estate Prices
9) Capacity Utilization (leading indicator) Vs. Unemployment Rate
10) Net Commercial Short Positions Vs. Bond Yields (Alternative Site)
11) Net Non-Commercial Long Positions Vs. Bond Yields
12) % Change in Gold Vs. Real Interest Rates on 10 Year Treasuries 
13) Shanghai Silver Premium Vs. Silver Price
14) Probability of Recession Vs. 10 year - 3 year Yield Spread (link 2)
15) Junk Silver Premium Vs. Silver Price
16) Wage Inflation Vs. Unemployment Rate
17) Initial Unemployment Claims Vs. S&P
18) Gold/Silver Ratio Vs. S&P
19) GLD Flows Vs. Shanghai Gold Premium
20) Unemployment Rate Vs. Real GDP (leading indicator)
21) Mortgage Rates Vs. Mortgage Applications
22) Single Family Housing Starts Vs. Unemployment Rate
23) Tax Revenue Vs. Personal Savings Rate
24) Change in Non-Farm Payrolls Vs. Change in Unemployment Rate
25) Fed Funds Rate Vs. Unemployment Rate
26) Labor Force Participation Rate Vs. Unemployment Rate
27) M1 Money Supply (leading indicator) Vs. CPI
28) GOFO Vs. Gold Premium 
29) Shanghai Silver Inventory Vs. Shanghai Silver Premium 
30) Misery Index Vs. Forward P/E Ratio 
31) Flattening Yield Curve Vs. Fed Funds Rate
32) Oil Contango Vs. Oil Price 
33) Business Inventory to Sales Ratio (leading indicator) Vs. GDP Growth 
34) QE (leading indicator) Vs. Deficit 
35) Credit Spread (leading indicator) Vs. S&P  
36) Gold/Silver Ratio Vs. CPI 
37) Temporary Workers Vs. Recession 
38) Stock to Use Ratio Vs. Agriculture Price 
39) Help Wanted Online Ads (leading indicator) Vs. Unemployment Rate 
40) Federal debt held by foreigners Vs. 10 Year U.S. Yield 
41) Economic Policy Uncertainty (leading indicator) Vs. GDP Growth 
42) U.S. Treasury Cash Balance Vs. Monetary Base 
43) Gold Price Vs. Gold Production
44) Yield Curve (leading indicator) Vs. VIX
45) Copper/Zinc/Lead Production Vs. Silver Price 
46) Youth Employment Vs. Initial Jobless Claims  
47) Maturity of Debt Vs. Budget Deficit
48) Put/Call Ratio Vs. Stocks
49) Non-Farm Payroll (leading indicator) Vs. Unemployment Rate 
50) Household Durables Good Time to Purchase (leading indicator) Vs. Unemployment Rate  
51) Productivity Vs. Inflation
52) Phillips Curve: Unemployment Vs. Inflation 
53) Palladium/Platinum COMEX Stock Vs. Palladium/Platinum Price 
54) Oil Vs. CCC Junk Bonds 
55) Savings-Investments Vs. Housing 
56) COMEX Silver Vs. Silver Price 
57) COT Swap Dealers Vs. Gold Price
58) Existing Home Sales Vs. Housing Inventory
59) Oil Inventories Vs. Rig Counts
60) Outstanding Shorts Vs. Stock Price

These are a lot of correlations that you need to monitor on a day to day basis!

zondag 24 augustus 2014

Market Outlook

(First I want to thank Jeff for giving me an idea to go over our correlations as I was completely out of ideas on blog posting... )

Our "Correlation Economics" website has already amassed more than hundred correlations describing stock and bond valuations, gold, debt, deficits, the mortgage market, employment, GDP, etc...

In this article I'll go over the most prominent market moving correlations to give a thorough market outlook for the coming months. This way, investors know what to expect in the future. I'll also briefly touch my favourite correlations in the process.

Go here to see the analysis.

woensdag 19 maart 2014

List of Correlations: 100th correlation

As you know, I keep a page with all discovered correlations here:
http://katchum.blogspot.be/2013/03/update-list-of-discovered-correlations.html


And today I have found my 100th positive correlation. Let's celebrate!

Positive correlations:
1) Silver premium Vs. Silver Price 
2) Baltic Dry Vs. Industrial Commodities
3) Baltic Dry Vs. Copper
4) Copper Vs. S&P
5) Oil Vs. Dow Jones
6) Agriculture Price Vs. Health of Economy
7) Agriculture Vs. Fertilizer Price 
8) CRB Index Vs. Commodity prices (oil, agriculture, metals)
9) MZM velocity Vs. Inflation
10) MZM velocity Vs. 10 year U.S. treasury yield
11) Case-Shiller Index Vs. Housing Market Index
12) Capacity Utilization Vs. Inflation
13) Rhodium Price Vs. Automotive Industry
14) Housing Price Vs. Rise of Wages
15) O-metrix Score Vs. Stock Value
16) Outlay Spending Vs. Hyperinflation
17) Gold Money Index Vs. Gold Price
18) Stock Dividend to Bond Yield ratio Vs. Stock Price
19) War Vs. Silver Price
20) Exchange Rate Vs. Treasury Bond Valuation
21) PMI Vs. GDP Growth Rate
22) Gold Lease Rate Vs. Gold Price
23) Economy of Australia/Canada Vs. Industrial Commodities
24) Jim Sinclair's Fed Custodials Vs. Gold Price
25) LCNS silver net short positions Vs. Silver Price
26) ECB Deposit Rate Vs. Euribor and Deposit Facility
27) China Gold Imports from Hong Kong Vs. Gold Price
28) AUD/USD Vs. Iron Ore
29) Chinese yoy GDP growth Vs. Chinese yoy Power Consumption (link 2)
30) Chinese yoy Power Consumption Vs. Chinese yoy Power Production
31) M1 and Gold
32) Obesity Vs. Debt
33) Global Equity Prices Vs. Global EPS revisions
34) Total Public Debt Vs. Interest Payment on Debt
35) U.S. Bond Yields Vs. Interest Payment on Debt
36) Federal Reserve Balance Sheet Vs. S&P
37) Federal Reserve Balance Sheet Vs. Gold Price
38) Balance Sheet Ratio Fed/ECB Vs. EUR/USD 
39) China Manufacturing PMI Vs. Base Metal Prices
40) COMEX stock level Vs. CFTC Open Interest
41) Manufacturing component of Industrial Production Vs. CRB Metals Index
42) Net Short Interest Gold Vs. Gold Price
43) Central Bank Net Gold Buying Vs. Gold Price
44) LCNS silver Vs. Silver Open Interest
45) Bond Yields Vs. Gold Price
46) Gold Miners Bullish Percent Index Vs. GDX
47) Daily Sentiment Index Gold Vs. Gold Price
48) Commercial Net Short Interest Vs. Silver Price
49) Food Stamp Participation Rate Vs. Unemployment Rate
50) Bitcoin Price Vs. Gold Price
51) Credit Expansion Vs. Economic Health (second link)
52) Gold Volatility Vs. Gold Price
53) Total Stock Market Index Vs. GDP
54) Brent Crude Oil Vs. WTI Crude Oil
55) EPS revisions Vs. P/E Ratio
56) Citigroup Surprise Index (CESI) Vs. S&P 
57) EPS revisions Vs. S&P
58) Dow Theory: Dow Jones Transportation Average Vs. Dow Jones Industrial Average
59) Margin Balance Vs. S&P
60) Federal Debt Growth Vs. 10 Year Treasury Yields
61) Fed Funds Rate Vs. 10 Year Treasury Yields
62) Total Central Bank Balance Sheet Vs. Gold Price
63) Large Commercial Short in Copper Vs. Copper Price
64) Bond Yields (<3%) Vs. P/E Ratio
65) ECB Lending (LTRO) Vs. Deposits at Banks
66) Disposable Income Vs. Housing Prices
67) Fixed (conventional) Mortgage Rate Vs. Treasury Yields
68) Adjustable Mortgage Rate Vs. Federal Funds Rate
69) Silver Vs. Bitcoin
70) Open Interest Trend Vs. Price Trend
71) Wage Inflation Vs. Consumer Price Index (CPI)
72) Marginal Cost of Gold Suppliers Vs. Gold Price (link 2)
73) Durable Goods Orders Vs. S&P
74) Gold ETF Trust (GLD) Vs. Gold Price
75) PMI (leading indicator) Vs. S&P Revenues
76) Federal Funds Rate Vs. LIBOR Rate
77) Lumber Price (leading indicator) Vs. Housing
78) Building Permits (leading indicator) Vs. Housing
79) Pending Home Sales Vs. Mortgage Applications
80) Employment-Population Ratio Vs. Real GDP per Capita
81) Trade Surplus/Deficit (leading indicator) Vs. Currency Strength/Weakness
82) German Treasury Yields Vs. U.S. Treasury Yields
83) Consumer Sentiment Index (leading indicator) Vs. S&P 500
84) Bitcoin Price Vs. Bitcoin Users
85) Potemkin Rally Vs. Employment to Population Ratio
86) LME Copper Warehouse Stock Level Vs. Copper Contango
87) Art Price (leading indicator) Vs. CPI
88) Total Credit Market Debt Vs. Dow Jones
89) SGE gold deliveries (leading indicator) Vs. China Gold Imports from Hong Kong
90) Retail Sales Vs. Disposable Personal Income Per Capita
91) CRB Index Vs. Emerging Markets
92) Non Farm Payrolls Vs. Job Hires
93) Currency Debasement Vs. High Yielding Assets (Carry Trade) 
94) Deposits over Loans: Excess Reserves 
95) Food Price (leading indicator) Vs. Potash Price 
100) Federal Funds Rate Vs. CPI

Negative correlations:
1) Copper Price Vs. Copper Futures Contango
2) Interest Rates (bond yields >3%) Vs. P/E ratio of gold mines
3) Non-Farm Payrolls Vs. Unemployment Rate
4) Federal Debt Held by Foreigners Vs. U.S. Bond Yields
5) Size of Governments Vs. Their Economies
6) Stocks Vs. U.S. Dollar
7) Silver Stock at CME Vs. Silver Price
8) China Reserve Requirements Vs. Shanghai Real Estate Prices
9) Capacity Utilization Vs. Unemployment Rate
10) Net Commercial Short Positions Vs. Bond Yields (Alternative Site)
11) Net Non-Commercial Long Positions Vs. Bond Yields
12) % Change in Gold Vs. Real Interest Rates on 10 Year Treasuries 
13) Shanghai Silver Premium Vs. Silver Price
14) Probability of Recession Vs. 10 year - 3 year Yield Spread
15) Junk Silver Premium Vs. Silver Price
16) Wage Inflation Vs. Unemployment Rate
17) Initial Unemployment Claims Vs. S&P
18) Gold/Silver Ratio Vs. S&P
19) GLD Flows Vs. Shanghai Gold Premium
20) Unemployment Rate Vs. Real GDP (leading indicator)
21) Mortgage Rates Vs. Mortgage Applications
22) Single Family Housing Starts Vs. Unemployment Rate
23) Tax Revenue Vs. Personal Savings Rate
24) Change in Non-Farm Payrolls Vs. Change in Unemployment Rate
25) Fed Funds Rate Vs. Unemployment Rate
26) Labor Force Participation Rate Vs. Unemployment Rate
27) M1 Money Supply (leading indicator) Vs. CPI

These are a lot of correlations that you need to monitor on a day to day basis!

zaterdag 7 december 2013

Labor Force Participation Rate Vs. Unemployment Rate

We all know the Unemployment Rate is rigged by the U.S. government. A much better indicator is the Labor Force Participation Rate. Historically, we see a negative correlation between the Labor Force Participation Rate and the Unemployment Rate.


Whenever the LFPR goes up (blue chart), we see a decline in the unemployment rate (red chart) and vice versa. This correlation has been true until 2008, where the U.S. government falsified the unemployment numbers and added hedonic adjustments. The red line should be going upwards since 2010 if we include discouraged workers, part-time workers, disabled workers, etc...

So, the key is to look at the labor force participation rate.

More info here. Labor force participation rate = green circle divided by yellow circle = amount of people who are working or seeking for work


For more information, here is a chart with a longer time frame of the labor force participation rate for the working age population (25 - 54 years).

woensdag 20 november 2013

Art Prices Predict CPI

From Kingworldnews:
According to Austrian Business Cycle Theory the prices of capital goods (= asset price inflation) increase first in the course of an inflationary process, while consumer price inflation (= rising consumer prices) only ensues later. The asset price inflation that is currently in train can be identified by a multitude of symptoms. Prices for antiques, expensive wines, vintage cars, but also real estate and especially stocks recently increased strongly.
This quote is actually a very interesting one, because it can be added to our collection of correlations. Whenever you look at the trend in art, stocks, real estate (capital goods), you can predict the CPI. Because capital goods asset prices will always increase first and when this money flows into the economy, the CPI will increase afterwards. Note that art, stocks are not included in the CPI, that's why the CPI doesn't show inflation yet.

Peter Schiff has explained this too in one of his radio shows. He says that the QE that we see now is boosting asset prices. Eventually all these earnings will flow to the consumer and that's when we will see the CPI go up.

So in the graphs below, you will first see the red (art), yellow (stocks) and blue line (real estate) go up and afterwards the CPI will increase. That's why I believe that stocks can go down, while the CPI keeps going up, because we have this delay.


zondag 17 november 2013

Correlation: Employment to Population Ratio Vs. Potemkin Rally

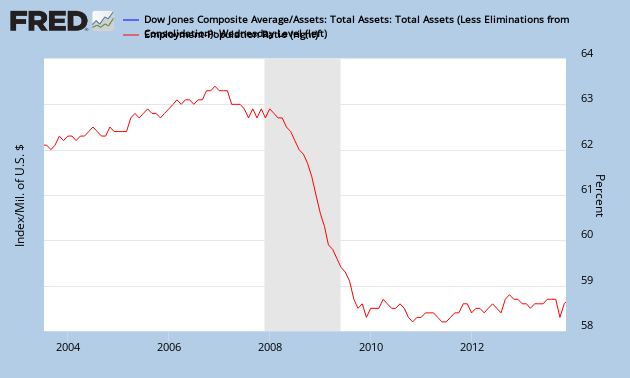
I read about a very unusual correlation at Zerohedge. Apparently, there is a similarity between the employment to population ratio (red graph) and the Potemkin Rally (blue graph). (The Potemkin Rally graph measures the ratio between the stock market and the Fed's Balance Sheet.)


There are implications if this correlation is true. It means that when the U.S. government prints money (otherwise known as QE), the blue graph goes down (in a scenario where the stock market flattens out). If the blue graph goes down, the red graph goes down too, which means the unemployment rate goes up.

This means we are venturing into a paradox. It means that we get to a stage where money printing makes the unemployment rate go up instead of down. Janet Yellen's QE won't help employment.

But the alternative is equally bad. Not to print money could make the stock market crash, which will also result in a declining blue chart. So we are now stuck between a rock and a hard place.

maandag 11 november 2013

Bitcoin Correlated To The Amount Of Bitcoin Users

In the Bitcoin world, more and more people are using this virtual currency. Chart 1 gives the amount of transactions a day and it's booming. If you really think more and more users are going to use Bitcoin, you will know that this chart 1 is going up.

Chart 1: Bitcoin: Transactions Per Day
When more people use Bitcoin, while there is a finite supply (Chart 3), of course the price of Bitcoin will go up (Chart 2). 1 Bitcoin costs around $400.

Chart 2: Bitcoin: Market Price
Chart 3: Bitcoin: Amount of Bitcoins in Circulation

With that increase in market price of 1 Bitcoin, the market cap is now $4 billion. Which is still a very small number compared to how big our world is. So I believe there is still a lot of upside.


Chart 4: Bitcoin: Market Capitalization

As long as the governments don't interfere, I believe the market of Bitcoin will continue to grow as more and more users pile into this virtual world (Chart 5). Chart 5 gives the amount of Bitcoin addresses, which is more or less the equivalent of the amount of users.

Chart 5: Bitcoin: Amount of unique Bitcoin addresses
This last chart is the key to watch, as more and more people use Bitcoin, you will see more and more adresses, because a Bitcoin address is almost the same as opening a bank account.

Now compare Chart 5 to Chart 2. Yes, that's your correlation.

Bitcoin's price is correlated to the amount of user accounts. If you believe that more and more people are going to use Bitcoin, you will know the price of Bitcoin will go up. People can say it's a Ponzi scheme, that it's a hype, but I say a market of Bitcoin and related tangible buy-able products will not disappear from the earth. Their presence will only increase. So it wasn't that complicated, Bitcoin doesn't follow the gold price, it was much simpler, Bitcoin followed the hype itself. The higher the demand, the higher the price.

Buy 1 bitcoin if you dare, that $400 might multiply to $400000 in a few years.

vrijdag 8 november 2013

Consumer Sentiment Index Vs. S&P 500

There is a correlation between consumer sentiment and the forward P/E ratio on the S&P 500. Investors will be willing to pay increasing multiples if they are confident that the future streams of earnings are sustainable and forecastable.

If we know that forward earnings are a measure of how confident investors are to buy stocks compared to the earnings of the stocks, then we know that the forward P/E ratio is correlated to the S&P 500 itself. By deduction, the consumer sentiment index is correlated to the S&P 500.

The consumer index (blue chart) is a leading indicator for economic trends so if we see a drop in the blue chart, the red chart (S&P 500) will go down a few months later.


zaterdag 3 augustus 2013

Tax Receipts Vs. Savings Rate

Whenever the government raises taxes or when corporate profits rise, tax revenue will rise with it (blue chart).

But this has implications, if tax revenues rise, this will deplete the personal savings of the people. The red chart shows the personal savings rate (%). There is a negative correlation to be found here.

It shows us that higher tax revenues always lead to lower personal savings rates and vice versa. From this correlation we can deduct one thing. There is a limit to raising tax revenues. If the personal savings rate gets to 0%, there is no more margin to increase taxes.

At this moment the personal savings rate is 4.4% and is almost at a historic low. Contrast this to the savings rate of China, which is 50%. Also note that tax revenues have been declining as a percentage of GDP. This means that corporate earnings growth isn't keeping up with GDP growth at a constant rate of taxation.

To read more about this correlation go to this article.

woensdag 3 juli 2013

Correlation: Mortgage Rates Vs. Mortgage Applications Vs. Pending Home Sales

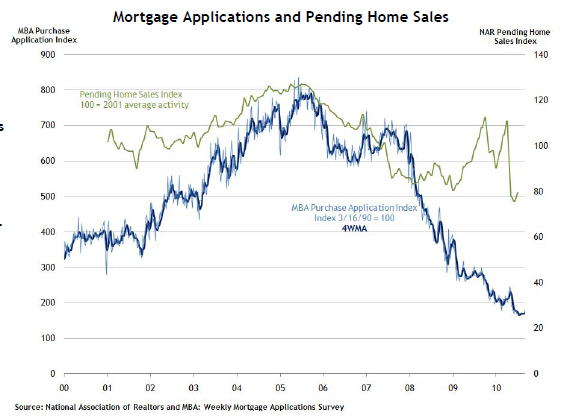
Just discovered another correlation on Zero Hedge. If mortgage rates go up, lending becomes more difficult, so people stop applying for new mortgages. This means there is a negative correlation between mortgage rates and mortgage applications.


When mortgage applications go down, not a lot of homes will be sold. This means that home sales will go down. As suggested by the following chart, there is a correlation here between mortgage applications and pending home sales. In fact, mortgage rates/mortgage applications are a leading indicator for pending home sales as presented in this Zerohedge article.

If it's true that interest rates and mortgage rates will go up, you can bet that we will have another housing crisis. Home sales go down. All those homes will be coming onto the market, while nobody wants them.

zaterdag 30 maart 2013

Correlation: Recession Vs. Yield Spread

I came across an interesting article that gives an empirical correlation between the yield spread between the 10 year and 3 month treasuries/bill and the probability of a recession when that yield spread narrows.

The key is to monitor that the 10 year yield is always higher than the 3 month yield. If the 10 year yield starts to go closer to the 3 month yield and even goes below it, then we have a high probability of a recession.

That correlation can be witnessed on chart 1. Each time the blue line goes below zero, we have a recession.
Chart 1: Recession Vs. Yield Spread

The last recession was in 2008. A few years before, the yield spread went to zero. Today we're in pretty safe territory (Chart 2). The green line minus the black line is 2%. If we see the black line go up again or the green line go down, we are in trouble. That's why the Federal Reserve never will increase the fed funds rate. Otherwise the black line will spike upwards.

No problems today. But it pays off to watch the yield spread each month or so.

Chart 2: U.S. bond yields
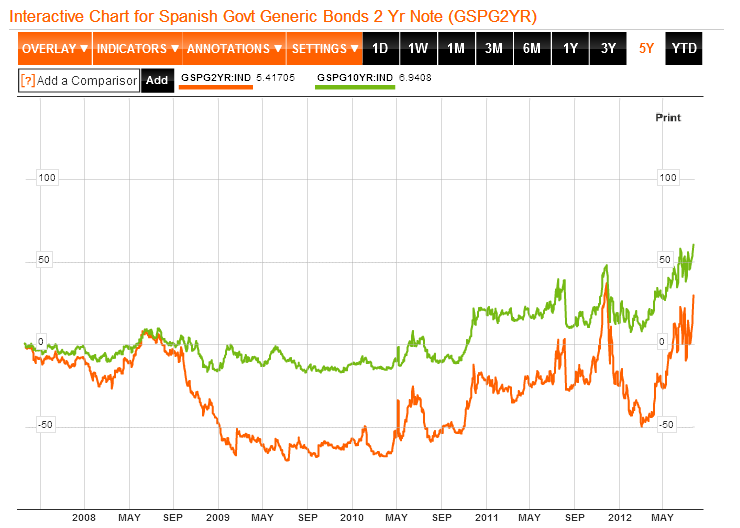
This theory is applicable to every country. I analyzed Spain for example in this article. 

Chart 3: Spanish Bond Yields (10 year vs 2 year)

donderdag 21 maart 2013

List of All Discovered Correlations

Once in a while I need to post an update on all discovered correlations, we're getting a huge list already. If I only had some software to get automatic updates of these charts...

Positive correlations mean that if one goes up, the other goes up too. Negative correlations mean that if one goes up, the other goes down.

Positive correlations:
1) Silver/Gold premium Vs. Silver/Gold Price  (link 2)
2) Baltic Dry Vs. Industrial Commodities
3) Baltic Dry Vs. Copper
4) Copper Vs. S&P
5) Oil Vs. Dow Jones
6) Agriculture Price Vs. Health of Economy
7) Agriculture/Food (leading indicator) Vs. Fertilizer Price (link 2)
8) CRB Index Vs. Commodity prices (oil, agriculture, metals)
9) MZM velocity Vs. Inflation
10) MZM velocity Vs. 10 year U.S. treasury yield
11) Case-Shiller Index Vs. Housing Market Index
12) Capacity Utilization Vs. Inflation
13) Rhodium Price Vs. Automotive Industry
14) Housing Price Vs. Rise of Wages
15) O-metrix Score Vs. Stock Value
16) Outlay Spending Vs. Hyperinflation
17) Gold Money Index Vs. Gold Price
18) Stock Dividend to Bond Yield ratio Vs. Stock Price
19) War Vs. Silver Price
20) Exchange Rate Vs. Treasury Bond Valuation
21) PMI Vs. GDP Growth Rate
22) Gold Lease Rate Vs. Gold Price (link2) (link3) (link4)
23) Economy of Australia/Canada Vs. Industrial Commodities
24) Jim Sinclair's Fed Custodials Vs. Gold Price
25) LCNS silver net short positions Vs. Silver Price
26) ECB Deposit Rate Vs. Euribor and Deposit Facility (Deposit ECB)
27) China Gold Imports from Hong Kong Vs. Gold Price
28) AUD/USD Vs. Iron Ore
29) Chinese yoy GDP growth Vs. Chinese yoy Power Consumption (link 2)
30) Chinese yoy Power Consumption Vs. Chinese yoy Power Production
31) M1 and Gold
32) Obesity Vs. Debt
33) Global Equity Prices Vs. Global EPS revisions
34) Total Public Debt Vs. Interest Payment on Debt
35) U.S. Bond Yields Vs. Interest Payment on Debt
36) Federal Reserve Balance Sheet Vs. S&P
37) Federal Reserve Balance Sheet Vs. Gold Price
38) Balance Sheet Ratio Fed/ECB Vs. EUR/USD 
39) China Manufacturing PMI Vs. Base Metal Prices
40) COMEX stock level Vs. CFTC Open Interest
41) Manufacturing component of Industrial Production Vs. CRB Metals Index
42) Net Short Interest Gold Vs. Gold Price
43) Central Bank Net Gold Buying Vs. Gold Price
44) LCNS silver Vs. Silver Open Interest
45) Bond Yields Vs. Gold Price
46) Gold Miners Bullish Percent Index Vs. GDX
47) Daily Sentiment Index Gold Vs. Gold Price
48) Commercial Net Short Interest Vs. Silver Price
49) Food Stamp Participation Rate Vs. Unemployment Rate
50) Bitcoin Price Vs. Gold Price
51) Credit Expansion Vs. Economic Health (second link)
52) Gold Volatility Vs. Gold Price
53) Total Stock Market Index Vs. GDP
54) Brent Crude Oil Vs. WTI Crude Oil
55) EPS revisions Vs. P/E Ratio
56) Citigroup Surprise Index (CESI) Vs. S&P 
57) EPS revisions Vs. S&P
58) Dow Theory: Dow Jones Transportation Average Vs. Dow Jones Industrial Average
59) Margin Balance Vs. S&P
60) Federal Debt Growth Vs. 10 Year Treasury Yields
61) Fed Funds Rate Vs. 10 Year Treasury Yields
62) Total Central Bank Balance Sheet Vs. Gold Price
63) Large Commercial Short in Copper Vs. Copper Price
64) Bond Yields (<3%) Vs. P/E Ratio
65) ECB Lending (LTRO) Vs. Deposits at Banks
66) Disposable Income Vs. Housing Prices
67) Fixed (conventional) Mortgage Rate Vs. Treasury Yields
68) Adjustable Mortgage Rate Vs. Federal Funds Rate
69) Silver Vs. Bitcoin
70) Open Interest Trend Vs. Price Trend
71) Wage Inflation Vs. Consumer Price Index (CPI)
72) Marginal Cost of Gold Suppliers Vs. Gold Price (link 2)
73) Durable Goods Orders Vs. S&P
74) Gold ETF Trust (GLD) Vs. Gold Price
75) PMI (leading indicator) Vs. S&P Revenues
76) Federal Funds Rate Vs. LIBOR Rate
77) Lumber Price (leading indicator) Vs. Housing
78) Building Permits (leading indicator) Vs. Housing
79) Pending Home Sales Vs. Mortgage Applications
80) Employment-Population Ratio Vs. Real GDP per Capita
81) Trade Surplus/Deficit (leading indicator) Vs. Currency Strength/Weakness
82) German Treasury Yields Vs. U.S. Treasury Yields
83) Consumer Sentiment Index (leading indicator) Vs. S&P 500
84) Bitcoin Price Vs. Bitcoin Users
85) Potemkin Rally Vs. Employment to Population Ratio
86) LME Copper Warehouse Stock Level Vs. Copper Contango
87) Art Price (leading indicator) Vs. CPI
88) Total Credit Market Debt Vs. Dow Jones
89) SGE gold deliveries (leading indicator) Vs. China Gold Imports from Hong Kong (link 2)
90) Retail Sales Vs. Disposable Personal Income Per Capita
91) CRB Index Vs. Emerging Markets
92) Non Farm Payrolls Vs. Job Hires
93) Currency Debasement Vs. High Yielding Assets (Carry Trade) 
94) Deposits over Loans: Excess Reserves 
95) Food Price (leading indicator) Vs. Fertilizer Price
100) Federal Funds Rate Vs. CPI 
101) Full-time Vs. Part-time Workers (Recession) 
102) GLD ETF Vs. COMEX Stock 
103) GDP Growth Rate Vs. 10 Year Bond Yield 
104) Depletion Curve Vs. Price Movement (silver, oil)
105) Managed Money Long and Short Positions (gold and silver) Vs. Gold and Silver Price (link)
106) GDP Vs. Trade Balance 
107) Smart Money Flow Index (leading indicator) Vs. Dow Jones 
108) Bank Deposits Vs. Deposit Rates 
109) GOFO rate Vs. Gold Price (link 2)
110) Federal Reserve Asset Purchases Vs. Bond Yields 
111) Currency Vs. Bonds 
112) Retail Sales (leading indicator) Vs. Consumer Price Index (CPI)
113) Stock Buyback Vs. S&P 
114) Yen USD/JPY Carry Trade Vs. Gold (link 2)
115) Yen USD/JPY Carry Trade Vs. Stocks 
116) Leading/Coincident/Lagging Indicator Vs. Recession 
117) Gold per Capita Vs. Income per Capita
118) GLD ETF Stock Vs. Total U.S. ETF gold Stock
119) Gold Repatriation Vs. Recession 
120) Dividend Yield Vs. Bond Yield 
121) Misery Index Vs. Gold 
122) Palm Oil (leading indicator) Vs. Soybean Oil Vs. Crude Oil 
123) Junk Bonds Vs. Stock Market 
124) Junk Bonds Vs. Energy Junk Bonds Vs. Oil 
125) P/E Ratio Vs. M/O Age Ratio 
126) Tax Revenues Vs. Stock Markets 
127) Employment to Population Ratio (leading indicator) Vs. Wage Growth
128) Equity Valuation and Annualized Return Vs. Q Ratio (James Tobin)
129) Chapwood Index Vs. CPI 
130) Working Age Population (15-24) Vs. CPI 
131) ISM Manufacturing PMI (leading indicator) Vs. ISM Services PMI 
132) Global FX Reserves Vs. Global Equities 
133) Corporate Loan Charge-Offs and Delinquencies Vs. Federal Funds Rate (leading indicator)
134) Breadth Advance-Decline Line (leading indicator) Vs. Stocks
135) USD/CNY Vs. Crude Oil
136) USD/CNY (leading indicator) Vs. S&P 
137) Corporate Profits (leading indicator) Vs. Employment 
138) Debt to GDP (leading indicator) Vs. Default Rate 
139) African Rand Vs. Silver 
140) GDP Output Gap (leading indicator) Vs. Inflation 
141) Yield Curve (leading indicator) Vs. Coincident Indicator 
142) GDP (leading indicator) Vs. Oil 
143) Credit Risk: LIBOR (leading indicator) Vs. Fed Funds Rate
144) Cross-Asset Correlation Vs. Gold 
145) Quits Rate (leading indicator) Vs. Wage Inflation
146) Rig Count (leading indicator) Vs. Oil Production
147) U.S. Dollar Liquidity Vs. Emerging Market Stocks 
148) Loan Growth Vs. Interest Rates
149) Copper/Gold Ratio Vs. 10 Year Bond Yield 
150) Bond Yields Vs. Unrealized Losses Federal Reserve  (central bank solvency)
151) Trade War Vs. Inflation Vs. GDP
152) Gold/Silver Minus Oil Vs. HUI 
153) Silver Depletion Vs. Silver Production
154) Yield Curve Vs. Net Interest Margin 
155) PPI (leading indicator) Vs. CPI 
156) LIBOR Vs. Jumbo CD  
157) Initial Jobless Claims (leading indicator) Vs. Unemployment Rate 
158) Yield Curve Vs. Net Interest Margin 
159) 3-2 Year Yield (leading indicator) Vs. 2-1 Year Yield
160) Open Interest (leading indicator) Vs. Gold Price Vs. Gold ETF Buying  (link 2)
161) 2 Year Yield (leading indicator) Vs. Fed Funds Rate 
162) Gold Vs. Negative Yielding Debt
163) AAA Credit Spread (leading indicator) Vs. Real GDP 
164) Maturity of Debt Vs. Debt to GDP 
165) SHFE Silver Warehouse (leading indicator) Vs. Silver Price 
166) Freights Vs. Real GDP 
167) PSLV Vs. Silver Price
168) Chinese Yuan Vs. Chinese Foreign Exchange Reserves 
169) OECD Leading Index (leading indicator) Vs. S&P Revenue 
170) China Credit Impulse (leading indicator) Vs. China GDP 
171) Credit Card Interest Rate Vs. 10 Year Bond Yield 
172) SOFR Vs. LIBOR 
173) QE Vs. Yield Curve
174) Suicide Rate Vs. Unemployment Rate 
175) Germany IFO Index (leading indicator) Vs. Germany GDP
176) Chinese Yuan Vs. China Errors and Omissions in Balance of Payments
177) NVT/RVT Vs. Bitcoin
178) Yardeni FSMI Vs. S&P
179) Gold Open Interest Vs. Gold Price
180) QE (leading indicator) Vs. PMI 
181) Monetary Base/Money Supply Vs. Gold Reserves 
182) China GDP Vs. Gold Price
183) New Home Price (leading indicator) Vs. Rent CPI 
184) Delinquencies (leading indicator) Vs. Unemployment Rate 
185) Taylor Rule Rate (leading indicator) Vs. Gold Price 
186) Commercial Paper Rates Vs. Repo 
187) Cass Freight Index Vs. Real GDP 
188) PCE Vs. CPI 
189) Profits Before Tax (leading indicator) Vs. Stock Market 
190) Disposable Income Vs. Housing 
191) VIX Vs. Margin Debt Gold Selling
192) LBMA Spot Gold/Silver Vs. COMEX Gold/Silver Futures 
193) Net International Investment Position (NIIP) Vs. Current Account 
194) Debt to GDP Vs. Stagflation 
195) Air Traffic Vs. Oil Vs. Stocks 
196) Air Freight Vs. Trade Balance 
197) Conceptions Vs. GDP
198) Mexican Peso Vs. Silver Price
199) PCE Vs. GDP
200) AUD (leading indicator) Vs. CNY
201) Gold Miner Hedging Vs. Gold Lease Rate
202) Budget Deficit Vs. Gold Price
203) Backwardation in Lease Rate (leading indicator) Vs. Silver Price
204) Silver Margin Hike Vs. Silver Volatility
205) COMEX Deliveries Vs. Gold Price
206) Rhodium (leading indicator) Vs. Palladium

Negative correlations:
1) Copper Price Vs. Copper Futures Contango
2) Interest Rates (bond yields >3%) Vs. P/E ratio of gold mines
3) Non-Farm Payrolls Vs. Unemployment Rate
4) Federal Debt Held by Foreigners Vs. U.S. Bond Yields
5) Size of Governments Vs. Their Economies
6) Stocks Vs. U.S. Dollar
7) Silver Stock at CME Vs. Silver Price
8) China Reserve Requirements Vs. Shanghai Real Estate Prices
9) Capacity Utilization (leading indicator) Vs. Unemployment Rate
10) Net Commercial Short Positions Vs. Bond Yields (Alternative Site)
11) Net Non-Commercial Long Positions Vs. Bond Yields
12) % Change in Gold Vs. Real Interest Rates on 10 Year Treasuries 
13) Shanghai Silver Premium Vs. Silver Price
14) Probability of Recession Vs. 10 year - 3 year Yield Spread (link 2)
15) Junk Silver Premium Vs. Silver Price
16) Wage Inflation Vs. Unemployment Rate
17) Initial Unemployment Claims Vs. S&P
18) Gold/Silver Ratio Vs. S&P
19) GLD Flows Vs. Shanghai Gold Premium
20) Unemployment Rate Vs. Real GDP (leading indicator)
21) Mortgage Rates Vs. Mortgage Applications
22) Single Family Housing Starts Vs. Unemployment Rate
23) Tax Revenue Vs. Personal Savings Rate
24) Change in Non-Farm Payrolls Vs. Change in Unemployment Rate
25) Fed Funds Rate Vs. Unemployment Rate
26) Labor Force Participation Rate Vs. Unemployment Rate
27) M1 Money Supply (leading indicator) Vs. CPI
28) GOFO Vs. Gold Premium 
29) Shanghai Silver Inventory Vs. Shanghai Silver Premium 
30) Misery Index Vs. Forward P/E Ratio
31) Flattening Yield Curve Vs. Fed Funds Rate
32) Oil Contango Vs. Oil Price 
33) Business Inventory to Sales Ratio (leading indicator) Vs. GDP Growth 
34) QE (leading indicator) Vs. Deficit 
35) Credit Spread (leading indicator) Vs. S&P  
36) Gold/Silver Ratio Vs. CPI 
37) Temporary Workers Vs. Recession 
38) Stock to Use Ratio Vs. Agriculture Price 
39) Help Wanted Online Ads (leading indicator) Vs. Unemployment Rate
40) Federal debt held by foreigners Vs. 10 Year U.S. Yield 
41) Economic Policy Uncertainty (leading indicator) Vs. GDP Growth 
42) U.S. Treasury Cash Balance Vs. Monetary Base 
43) Gold Price Vs. Gold Production
44) Yield Curve (leading indicator) Vs. VIX
45) Copper/Zinc/Lead Production Vs. Silver Price 
46) Youth Employment Vs. Initial Jobless Claims 
47) Maturity of Debt Vs. Budget Deficit
48) Put/Call Ratio Vs. Stocks
49) Non-Farm Payroll (leading indicator) Vs. Unemployment Rate 
50) Household Durables Good Time to Purchase (leading indicator) Vs. Unemployment Rate 
51) Productivity Vs. Inflation
52) Phillips Curve: Unemployment Vs. Inflation 
53) Palladium/Platinum COMEX Stock Vs. Palladium/Platinum Price 
54) Oil Vs. CCC Junk Bonds
55) Savings-Investments Vs. Housing 
56) COMEX Silver Vs. Silver Price
57) COT Swap Dealers Vs. Gold Price
58) Existing Home Sales Vs. Housing Inventory
59) Oil Inventories Vs. Rig Counts
60) Outstanding Shorts Vs. Stock Price

These are a lot of correlations that you need to monitor on a day to day basis!