What is ultimately the most important? Food.
- List of Correlations
- Gold Checklist
- Copper Checklist
- Gold Forecaster
- Oil Forecaster
- Stock Forecaster
- Bond Forecaster
- USD Forecaster
- Poo Forecaster
- Bitcoin Checklist
- Q Ratio
- Stock Valuation
- Leading/Coincident Indicator
- Misery Index
- Junk Bonds Vs. Stocks
- Currency Vs. Bonds
- Yield Curve Vs. Fed Funds Rate
- U.S. Bond Yields
- Dividend Yield Vs. Bond Yield
- QE Vs. Bond Yields
- Money Supply
- Dow Theory
- Excess Reserves
- Central Bank Balance Sheets
- Fed Balance Sheet Vs. Dow Jones
- Credit Spread Vs S&P
- Total credit Vs. Dow Jones
- Debt
- Debt Vs. Delinquency
- % Debt Held by Foreigners
- Interest Payment on Government Debt
- Disposable Income Vs. Housing
- Retail Sales Vs. Disposable Income
- Tax Revenue Vs. Stocks
- Tax Revenue Vs. Savings Rate
- NIIP Vs. Currency
- Trade Balance Vs. Currency
- Deficit
- Deficit to Outlay Ratio
- China Power Consumption Vs. China GDP
- Freight Vs. GDP
- Inventory Vs. GDP
- PCE Vs. GDP
- GDP Vs. Trade Balance
- GDP Vs. 10 Year Bond Yield
- GDP Vs. PMI
- Profits Vs. Employment
- Employment-Population Ratio Vs. Wages
- Employment-Population Ratio Vs. GDP per Capita
- Unemployment Vs. GDP
- Part-time Employment
- Productivity Vs. CPI
- Output Gap Vs. CPI
- Taylor Rule Rate Vs. Gold
- PPI/CPI/PCE
- Retail Sales Vs. CPI
- 2 Year Vs. LIBOR/SOFR Vs. Fed Funds Rate
- Loan Growth Vs. Fed Funds Rate
- Fed Funds Rate Vs. CPI
- Fed Funds Rate Vs. Unemployment
- Delinquencies Vs. Unemployment
- Delinquency Vs. Fed Funds Rate
- Labor Force Vs. Unemployment
- Non-Farm Payrolls Vs. Unemployment
- Quits Rate Vs. Wage Inflation
- Wage Inflation Vs. Unemployment
- Wage Inflation Vs. CPI
- M2 Vs. CPI
- Capacity Utilization Vs. CPI
- Capacity Utilization Vs. Unemployment
- New Homes Vs. Rents
- Lumber Vs. Housing
- Savings Vs. Housing
- Housing Starts Vs. Unemployment
- Initial Jobless Claims Vs. S&P
- Consumer Sentiment Vs. S&P
- Durable Goods Orders Vs. S&P
- Building Permit Vs. Housing
- Construction Vs. Housing
- Adjustable Mortgage Vs. Fed Funds Rate
- Fixed Mortgage Rates Vs. 30 Year Bond Yield
- MZM Vs. 10 Year Bond Yield
- Gold Vs. 10 Year Bond Yield
- Dow/Gold Ratio
- GOFO Vs. Gold
- Gold/Silver COMEX
Posts tonen met het label consumer. Alle posts tonen
vrijdag 1 april 2022
dinsdag 16 september 2014
Retail Sales Vs. Consumer Price Index
The retail sales report is a monthly economic indicator compiled and released by the Census Bureau and the Department of Commerce. It gives a monthly aggregated measure of sales of retail goods. So basically it gives the sales figure of what people bought the previous month.
If retail sales go up, it means people either bought more things, or prices went up for their goods or a combination of both. But I think retail sales are a good indicator of inflation.
The chart below clearly illustrates that retail sales are a leading indicator for the consumer price index, so everyone should monitor the retail sales numbers to get an idea on inflation.
Labels:
consumer,
correlation,
CPI,
index,
Price,
retail sales
woensdag 19 maart 2014
Federal Funds Rate Vs. Consumer Price Index
From the first FOMC meeting lead by Janet Yellen, we noticed one important statement:
"The Fed Funds Rate will be kept low when inflation stays at this low level."
Thus, we chart the Fed Funds Rate against the CPI and get this result.
There is a strong correlation between the Fed Funds Rate and the inflation rate (CPI).
So we expect that an increase in interest rates will only happen when inflation starts to rise. The unemployment rate is not on the radar anymore.
Notice that historically the Fed Funds Rate is higher than the inflation rate (positive real interest rate (above 0%)), but today the Fed Funds Rate is lower than the inflation rate (negative real interest rate (below 0%))
"The Fed Funds Rate will be kept low when inflation stays at this low level."
Thus, we chart the Fed Funds Rate against the CPI and get this result.
There is a strong correlation between the Fed Funds Rate and the inflation rate (CPI).
Notice that historically the Fed Funds Rate is higher than the inflation rate (positive real interest rate (above 0%)), but today the Fed Funds Rate is lower than the inflation rate (negative real interest rate (below 0%))
maandag 17 maart 2014
Japan's stock market is about to crash
If you want ideas which investment to make in the coming months, I would expect a decline in the Japanese stock market.
First, we note that the 10 year Japanese bond yield at 0.6% is pretty competitive against the dividend yields of Japanese stocks at 1.8% (Chart 1). So stocks aren't such good value anymore compared to a year ago when dividend yields were at 2.8% compared to a 10 year treasury yield of 0.7%. Moreover, the P/E ratio of Japanese stocks is currently at 13, which isn't particularly cheap.
Secondly, I have written extensively about the dire fiscal situation in Japan. Japan has a current account deficit, is printing money to stimulate their economy and more and more of its interest payments on Japanese debt is financed by less tax revenue. Obviously, this won't be bullish for Japanese stocks.
But most importantly, recent numbers on the consumer confidence in Japan, point to a decline in the stock market for the coming months.
Read on here.
First, we note that the 10 year Japanese bond yield at 0.6% is pretty competitive against the dividend yields of Japanese stocks at 1.8% (Chart 1). So stocks aren't such good value anymore compared to a year ago when dividend yields were at 2.8% compared to a 10 year treasury yield of 0.7%. Moreover, the P/E ratio of Japanese stocks is currently at 13, which isn't particularly cheap.
| Chart 1: Japan: Dividend yield Vs. Treasury Yield |
Secondly, I have written extensively about the dire fiscal situation in Japan. Japan has a current account deficit, is printing money to stimulate their economy and more and more of its interest payments on Japanese debt is financed by less tax revenue. Obviously, this won't be bullish for Japanese stocks.
But most importantly, recent numbers on the consumer confidence in Japan, point to a decline in the stock market for the coming months.
Read on here.
Labels:
confidence,
consumer,
Japan,
Nikkei
vrijdag 8 november 2013
Consumer Sentiment Index Vs. S&P 500
There is a correlation between consumer sentiment and the forward P/E ratio on the S&P 500. Investors will be willing to pay increasing multiples if they are confident that the future streams of earnings are sustainable and forecastable.
If we know that forward earnings are a measure of how confident investors are to buy stocks compared to the earnings of the stocks, then we know that the forward P/E ratio is correlated to the S&P 500 itself. By deduction, the consumer sentiment index is correlated to the S&P 500.
The consumer index (blue chart) is a leading indicator for economic trends so if we see a drop in the blue chart, the red chart (S&P 500) will go down a few months later.
If we know that forward earnings are a measure of how confident investors are to buy stocks compared to the earnings of the stocks, then we know that the forward P/E ratio is correlated to the S&P 500 itself. By deduction, the consumer sentiment index is correlated to the S&P 500.
The consumer index (blue chart) is a leading indicator for economic trends so if we see a drop in the blue chart, the red chart (S&P 500) will go down a few months later.
woensdag 10 juli 2013
Consumer Price Index: The effect of a rise in oil prices
With crude oil going back over $106/barrel (which is a 20% increase from $90/barrel), let's see how the CPI would do.
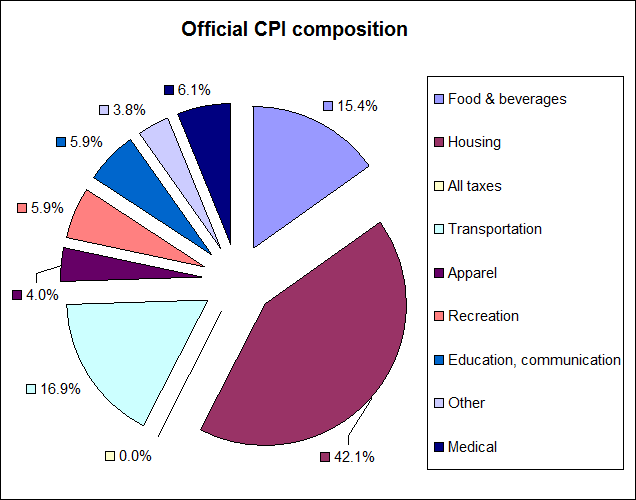
As you know, the consumer price index consists mostly of housing (42%), then second comes transportation (17%) and last comes food (15%).
The crude oil is part of the transportation segment. One third of the transportation segment is motor fuel or 5% of the CPI.
So if oil prices go up 20%, the CPI will only go up 20% x 5% = 1%.
More importantly, housing determines a major part of the CPI. Half of the housing segment consists of Owners’ equivalent rent of residences which is basically the amount of rent you would pay for staying in the house. This depends on the housing prices. 10% of the housing segment is fuel and utilities. So if oil goes up 20%, the housing segment will go up 10% x 20% = 2%. And the CPI would go up 2% x 40% = 1%.
| CPI |
So that's the significance of the oil price on the CPI.
zondag 21 april 2013
Wage Inflation Vs. CPI
This page is created to monitor the Average Hourly Earnings of Production Vs. Consumer Price Index (CPI).
The Average Hourly Earnings (blue chart) are a good indicator for the Consumer Price Index (CPI) (red chart).
It appears that the CPI is most volatile here, so the important trend to follow is the average hourly earnings.
zaterdag 20 april 2013
Capacity Utilization Rate Vs. Consumer Price Index
This page is created to monitor the Capacity Utilization Rate Vs. Consumer Price Index (CPI).
When capacity utilization goes above 80%, the industry goes above a threshold where it lacks capacity to produce. At that moment the only way to rebalance is to increase prices.
When the capacity utilization goes above 80% (blue chart), the CPI (red chart) will follow suit after 1 year as capacity utilization is a leading indicator for inflation.
donderdag 18 april 2013
Correlation: Wage Inflation Vs. Unemployment Rate Vs. Consumer Price Index
There is an inverse relationship between the unemployment rate and the wage inflation. Whenever people get unemployed, it means the economy isn't doing well. Employers won't be able to raise wages of the people during these difficult times, so you will get a low wage inflation trend (blue line). In these periods, the unemployment rate tends to go up (yellow line).
| Chart 1: Wage Inflation Vs. Unemployment Rate |
The same can be said the other way round. When the unemployment rate declines, people will demand a higher salary as skilled workers get scarcer. At this stage the wages will inflate.
It is also so that wages correlate highly with the consumer price index (CPI). So if the unemployment rate declines, you can expect a higher CPI as you can see on Chart 2.
So if you don't believe the CPI the government is reporting, you just look at the average hourly earnings. The average hourly earnings were positive in March. So I expect the CPI to increase too.
It is also so that wages correlate highly with the consumer price index (CPI). So if the unemployment rate declines, you can expect a higher CPI as you can see on Chart 2.
So if you don't believe the CPI the government is reporting, you just look at the average hourly earnings. The average hourly earnings were positive in March. So I expect the CPI to increase too.
| Chart 2: Average Hourly Earnings Vs. CPI |
Abonneren op:
Posts (Atom)