Posts tonen met het label funds. Alle posts tonen

dinsdag 3 oktober 2023

Federal Reserve Selling Bonds to Pensions

The Fed is selling trashury bonds to the pension funds, which are now deep underwater. 


Pension funds buying as market cap increases, but the value of the bonds actually keeps dropping.


maandag 31 augustus 2020

Pension funds allocate 5% into gold

Pension funds were never fond of gold. Only a mere US$16 billion (1,81% of $US900 billion) is invested by pension funds in gold and silver. In other words, 0,032% of all pension assets are invested in precious metals.


But lately, we see some pension funds starting to allocate 5% into gold. We know that 21% of global assets are pension funds, so 5% of 21% is 1%. If gold allocation increases 1%, this would double the global allocation in gold and will more than double the gold price as demand doubles.
This is because the formula of market capitalization is exponential.

Formula: C = (A+B)^2 / A^2
Where: 
A = initial market cap
B = net inflow of money
C = price multiplication


woensdag 12 augustus 2020

Hedge Funds Closing Silver Position

The hedge funds got out of silver a few days ago, but they will be back soon enough.


donderdag 8 augustus 2019

Lynette answers my question on pension funds

Thanks Lynette for answering my question:

"Is it possible that pension funds and mutual funds are buying negative rated bonds, because they need to hold a certain amount of funds?"


zaterdag 5 januari 2019

2 Year Yield Vs. Fed Funds Rate

If you want to predict whether the Fed will raise rates or not, you just need to look at the 2 year bond yield, which is a leading indicator for the Fed Funds Rate.

maandag 22 augustus 2016

Credit Risk: 2 Year Vs. LIBOR Vs. Fed Funds Rate

The LIBOR rate is a benchmark rate on interbank loans worldwide. It is the amount banks charge each other to borrow money. The counterpart to this is the Fed Funds Rate, which is risk-free.

When both rates diverge from each other, we can say that this is a warning sign and leading indicator for credit risk. It also means there isn't enough liquidity. This is reflected in the higher cost of borrowing from banks.


The Fed has cut rates since the financial crisis of 2008, but LIBOR doesn't follow and is even rising now in 2016, especially since the end of QE3 in 2015. This same thing that happened in 2008 will happen in 2016-2017. LIBOR diverged from the Fed Funds Rate and the Federal Reserve will need to come in and initiate QE4 or negative interest rates to bring down the LIBOR rate and provide liquidity.


The Fed funds rate tends to move with the 2 year treasury as well. The probability of a rate hike can be monitored here.


Eurodollar futures lead the fed funds rate.


Another similar indicator you can follow is the TED spread. The TED spread is the spread between 3-Month LIBOR and the 3-Month treasury bill based on US dollars. VIX is correlated to TED spread.


The FRA - OIS spread shows the willingness of banks to lend to each other.


Another indicator of credit risk is the bank term funding program to prop up failing regional banks.

woensdag 9 december 2015

Corporate Loan Charge-Offs and Delinquencies Vs. Fed Funds Rate

Corporate loan charge-offs are bad debts on the balance sheet that will be written off and will negatively affect earnings.

Delinquencies are obligations that have missed payment beyond their due date. If these delays keep on going for too long, the corporation is declared bankrupt.

What we see below is that the Fed Funds Rate is a leading indicator for these charge-offs and delinquencies. Every time the Fed Funds Rate is increased, charge-offs and delinquencies surge with a 6 month delay.


As delinquencies were already surging in 2015, it will be nearly impossible for the Federal Reserve to increase interest rates in 2016. The Federal Reserve is trapped.

Graphic below adds total revolving credit, which is the line of credit as a last resort, typically triggered when delinquencies rise.


More data on delinquencies.


vrijdag 12 december 2014

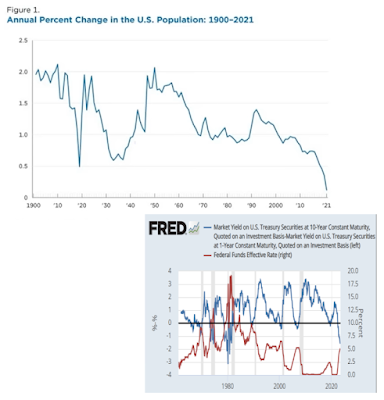
U.S. Bond Yield Curve Vs. Fed Funds Rate

There is a correlation between the yield curve and the Fed funds rate.

The yield curve plots the yield on Y-axis and maturity on X-axis. A flattening yield curve means that the yield of the different maturities are coming together and a recession starts.


On the following graph, the flattening yield curve can be witnessed by a drop to zero on the blue chart. Whenever this drop happens, a recession starts and the Federal Reserve comes to the rescue by decreasing the Fed funds rate. The problem today is that in the next recession in 2015, the Fed funds rate cannot be lowered anymore (red chart is already at 0%). The Fed is out of bullets.


To check how the yield curve will evolve, you can look at the leading indicator 3-2 year treasury yield.

Yield curve inversions happen when the population growth slows down.


Housing inventory is inversely correlated to the yield curve.


woensdag 19 maart 2014

Federal Funds Rate Vs. Consumer Price Index

From the first FOMC meeting lead by Janet Yellen, we noticed one important statement:

"The Fed Funds Rate will be kept low when inflation stays at this low level."

Thus, we chart the Fed Funds Rate against the CPI and get this result.

There is a strong correlation between the Fed Funds Rate and the inflation rate (CPI).

So we expect that an increase in interest rates will only happen when inflation starts to rise. The unemployment rate is not on the radar anymore.

Notice that historically the Fed Funds Rate is higher than the inflation rate (positive real interest rate (above 0%)), but today the Fed Funds Rate is lower than the inflation rate (negative real interest rate (below 0%))

zondag 22 september 2013

Federal Funds Rate Vs. Unemployment

The unemployment rate is a key indicator for the Federal Reserve to set the Fed Funds rate. Whenever the unemployment rate goes up, the Federal Reserve will lower interest rates. 

This can be witnessed on Chart 1 which gives the Employment-Population Ratio Vs. the Fed Funds Rate.

Chart 1: Federal Funds Rate Vs. Employment-Population Ratio
Since the economic crisis of 2008, the employment-population ratio has never really recovered, that's why there is very little incentive to ever increase interest rates.

Be advised that we need to look at the employment-population ratio rather than looking at the unemployment rate numbers, as these numbers are subjected to hedonic measures (discouraged workers, part-time workers), which started from 2008 onwards. To show this, look at Chart 2. You will see that since 2008, the correlation didn't apply anymore.


Indeed, the U.S. government has been manipulating the unemployment numbers since 2008 (Chart 3).

Chart 3: Unemployment Rate

vrijdag 21 juni 2013

Correlation: LIBOR Vs. Fed Funds Rate

The LIBOR rate at which the banks lend each other money, is an important element in calculating the gold lease rate. Obviously, this LIBOR rate is influenced by the Federal Reserve via the Fed Funds Rate.

As you can see on this chart, there is an almost 100% correlation between LIBOR and the Fed Funds Rate.


As the Federal Reserve said that they will keep interest rates at zero until 2015, LIBOR rates will keep floating around the 0% level.

This also means that the gold lease rate (LIBOR minus GOFO (Gold Forward Rate)) is entirely dependent on the GOFO rate as long as the Federal Reserve keeps interest rates near zero.

Once inflation begins to pick up though, the Federal Reserve will have to raise the Fed Funds Rate (contractionary monetary policy), which will increase LIBOR rates and this will tend to raise the gold lease rates. In turn, high gold lease rates are a bullish environment for gold prices.

Note that there is one power that will force the Federal Reserve to increase its Fed Funds Rate and that is the yields on the bond market and the mortgage market.

As you can see on this graph below, the adjustable mortgage rates are starting to edge upwards even with a zero interest rate policy. Government bond yields are also edging upwards. So eventually, the Federal Reserve will be pressured to increase interest rates to keep up with the rise in bond and mortgage yields.


Investors who are still invested in the U.S. bond market, are taking a huge risk at this stage, especially when Ben Bernanke is forced to implement contractionary monetary policies at some point. Who will buy these U.S. government bonds... As a matter of fact, foreign investors are already dumping U.S. bonds as shown in the foreign U.S. bond investors report of April 2013.


zondag 21 april 2013

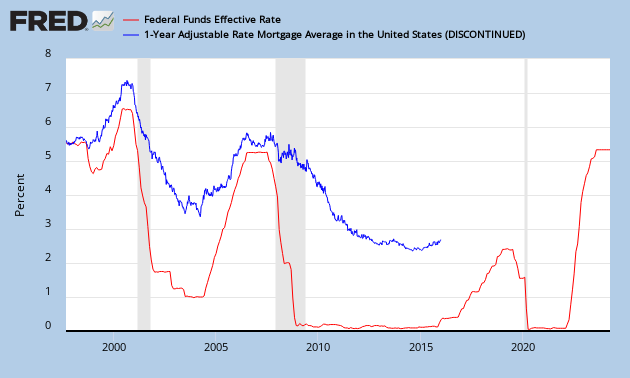
Adjustable Rate Mortgage Vs. Federal Funds Rate

This page is created to monitor the 1 Year Adjustable Rate Mortgage Average Vs. Effective Federal Funds Rate.

The Fed Funds Rate (red chart) sets the short term rates, in particular the 1 Year Adjustable Mortgage Rates.

Whenever the Federal Reserve increases/decreases the lending rate between banks, the short term rates will follow suit.

zaterdag 2 maart 2013

Correlation: Fed Funds Rate Vs. 10 Year Bond Yields

Another correlation Azizonomics taught me is the Fed Funds Rate Vs. 10 Year Bond Yield (Chart 1).

As long as the federal reserve keeps interest rates at zero, there is no way the 10 year bond yield will go up.

Chart 1: Fed Funds Rate Vs. 10 Year Bond Yields
If you think about this, we have 2 forces. One is debt growth (Chart 2), which is skyrocketing and the other one is the fed funds rate (Chart 1) which is at historic lows. Debt growth induces higher bond yields and low interest rates are inducing lower bond yields. I wonder which force will eventually win.
Chart 2: Public Debt Growth Vs. 10 Year Bond Yields
If the Federal Reserve even thinks about setting higher interest rates, the bond market will immediately collapse!