Corporate Profits = Government Deficit - Consumer Savings
Posts tonen met het label Savings. Alle posts tonen
Posts tonen met het label Savings. Alle posts tonen
donderdag 29 september 2022

vrijdag 2 oktober 2020
Savings Vs. Housing
When people have a lot of savings, they will be able to buy a lot of houses and the housing market goes up.
zaterdag 22 februari 2020
Savings-Investments Vs. Housing
When you subtract investments from savings, you are left with the amount of money that can be invested in the housing market. Looking at the chart below, in 2020 there is a huge amount of savings left to be invested in the housing market, so things are looking good.
donderdag 5 september 2019
China Vs. U.S.
There is a lot of talk about China collapsing. Let's compare China to the U.S.

Household debt: China's household debt to GDP is lower than the U.S. In fact, it is only 50% of GDP. Most of the debt is mortgage debt, but Chinese tend to pay at least 20% in cash for their house.


Corporate debt: China corporate debt is higher than the U.S. This is a bit of a problem. It is now at 150% of GDP. But these are mostly government owned debt from banks to corporations.

Savings rate: China has a much higher savings rate compared to the U.S.


maandag 7 maart 2016
Equation for Interest Rate Vs. Savings Rate
It seems like Japanese, Swiss, European people are saving more when we have negative interest rate policy. Why are people saving money when their money yields nothing?
The fact is that the higher the interest rate, the more you save as it gives nice returns on the bank. But when the interest rate hits 0%, weird things happen. Suddenly people start to save more due to uncertainty (in physical cash of course). No normal person will buy stocks because banks will collapse as they see their deposits go up in smoke. No normal person will buy bonds at negative interest. And no person will leave their cash in the bank. See chart below.

This is how I see the equation.

The fact is that the higher the interest rate, the more you save as it gives nice returns on the bank. But when the interest rate hits 0%, weird things happen. Suddenly people start to save more due to uncertainty (in physical cash of course). No normal person will buy stocks because banks will collapse as they see their deposits go up in smoke. No normal person will buy bonds at negative interest. And no person will leave their cash in the bank. See chart below.

This is how I see the equation.

maandag 23 december 2013
Tax Revenue To Come Down, U.S. Dollar To Weaken Further
One of the main reasons why I think that tax revenues will not increase anymore is because the people don't have any savings left at this stage.
There is a correlation between what the government receives in taxes (blue chart), and the savings rate (red chart). When the savings rate makes a bottom, this coincides with a top in tax revenue.

There is a correlation between what the government receives in taxes (blue chart), and the savings rate (red chart). When the savings rate makes a bottom, this coincides with a top in tax revenue.
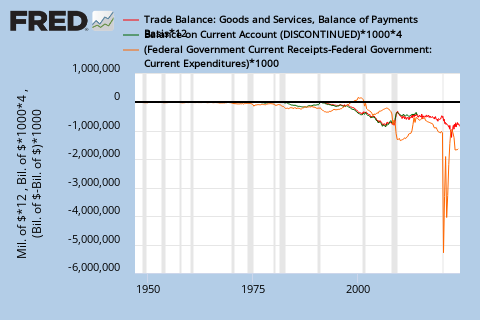
The savings rate just dropped to 4.2% from 4.5% and this will eliminate all hope that tax revenue will continue its increase. What this also means is that the deficit will likely continue to increase.
We already see this happening in the budget deficit, which has increased again (yellow chart). An increased deficit will weaken the U.S. dollar and put pressure on U.S. bonds (higher yields). With this information, you can prepare accordingly.

We already see this happening in the budget deficit, which has increased again (yellow chart). An increased deficit will weaken the U.S. dollar and put pressure on U.S. bonds (higher yields). With this information, you can prepare accordingly.
donderdag 10 oktober 2013
IMF has plans to impose 10% tax on deposits
What happened to Cyprus, doesn't stay in Cyprus. We already warned everyone about this in this article. What they do to Cyprus, they will do to every European country. That was my statement.
And here we finally have it. The IMF is setting up plans to impose a 10% tax on the savings of citizens of European countries.
I wonder what will happen to the deposits of the European banks. If I had savings in the bank, I would take them out of the bank and store them at home or buy gold.
=> And yes, the bank deposits are falling.

After citing their colleagues, IMF economists are throwing themselves into the water. "The tax rate needed to bring debt ratios (relative to GDP) to the level of the end of 2007 would require a tax of about 10% of all households with positive net savings." These calculations, we specify the IMF has been made to 15 countries in the euro zone. Let us recall that such arguments are intended merely suggestions to "theoretical" character. They are no less iconoclastic. But is it soft solutions leveraging outside of inflation, the most hypocritical of all?
I wonder what will happen to the deposits of the European banks. If I had savings in the bank, I would take them out of the bank and store them at home or buy gold.
=> And yes, the bank deposits are falling.

woensdag 7 augustus 2013
The Declining Trade Deficit: Not As Rosy As You Would Think
The trade deficit numbers are out for June 2013 and have been very positive. Due to an oil boom, the trade deficit shrank 22% from around $44 billion in January 2013 to $34 billion in June 2013.
As you can see on Chart 1, the decrease in deficit was due to an increase in exports (red chart) and a decrease in imports (blue chart). This looks very promising, but I want to show that not all is well if you look into the details.
 |
| Chart 1: Import Vs. Export |
 |
| Chart 2: Exports January 2013 |
 |
| Chart 3: Imports January 2013 |
If we then further look at how these numbers evolve in time from January 2013 till June 2013 we have charts 4 and 5.
 |
| Chart 4: Exports (billion USD) |
 |
| Chart 5: Imports (billion USD) |
To continue reading this analysis: go here.
zaterdag 3 augustus 2013
Tax Receipts Vs. Savings Rate
Whenever the government raises taxes or when corporate profits rise, tax revenue will rise with it (blue chart).
But this has implications, if tax revenues rise, this will deplete the personal savings of the people. The red chart shows the personal savings rate (%). There is a negative correlation to be found here.

It shows us that higher tax revenues always lead to lower personal savings rates and vice versa. From this correlation we can deduct one thing. There is a limit to raising tax revenues. If the personal savings rate gets to 0%, there is no more margin to increase taxes.
At this moment the personal savings rate is 4.4% and is almost at a historic low. Contrast this to the savings rate of China, which is 50%. Also note that tax revenues have been declining as a percentage of GDP. This means that corporate earnings growth isn't keeping up with GDP growth at a constant rate of taxation.
To read more about this correlation go to this article.
woensdag 26 juni 2013
The Housing Bubble is Deflating
With the recent surge in the mortgage yields, let's see how the housing market is doing. The two key metrics to look at are mortgage rates and household income. Let's analyze the mortgage rates first.
Historically, there is a high correlation between 30 year U.S. treasuries and 30 year mortgage rates (Chart 1). The chart shows that the 30 year treasury yield has spiked upwards starting in 2013, so I expect that the 30 year mortgage rates will spike upwards too. 30 year mortgage rates have already gone up from 3% to 4.9%, which had negative consequences for the real estate market, which is not priced in yet in the housing index.
As Zero Hedge reports, the affordability of housing is declining rapidly with rising mortgage yields. Every percentage increase in yields on 30 year mortgages will result in a 10% decline in affordability as the chart shows. If yields continue to go up to 6%, affordability would have declined about 40% since 2013.
The question is, will mortgage rates go up further? And what about the savings rate of the average citizen?
The answer is that real estate should be sold out of. Kyle Bass for example sold out of three of his real estate holdings: Newcastle Investment Corp (NCT), Hyatt Hotels Corporation (H) and Realogy Holdings Corp. (RLG ) - Real Estate Services.
=> Read it here.
Historically, there is a high correlation between 30 year U.S. treasuries and 30 year mortgage rates (Chart 1). The chart shows that the 30 year treasury yield has spiked upwards starting in 2013, so I expect that the 30 year mortgage rates will spike upwards too. 30 year mortgage rates have already gone up from 3% to 4.9%, which had negative consequences for the real estate market, which is not priced in yet in the housing index.
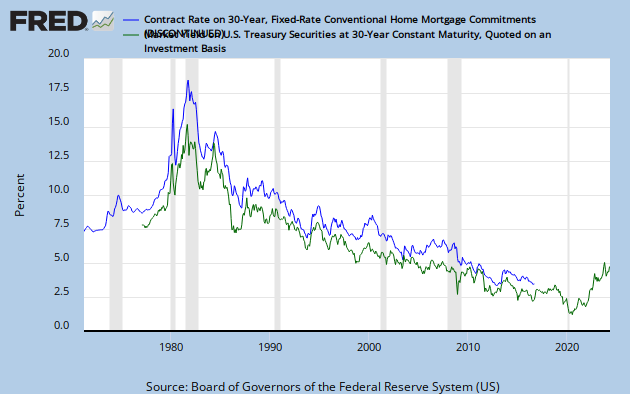 |
| Chart 1: Correlation between 30 year treasury yield and 30 year mortgage yield |
As Zero Hedge reports, the affordability of housing is declining rapidly with rising mortgage yields. Every percentage increase in yields on 30 year mortgages will result in a 10% decline in affordability as the chart shows. If yields continue to go up to 6%, affordability would have declined about 40% since 2013.
 |
| Chart 2: House Purchasing Power |
The answer is that real estate should be sold out of. Kyle Bass for example sold out of three of his real estate holdings: Newcastle Investment Corp (NCT), Hyatt Hotels Corporation (H) and Realogy Holdings Corp. (RLG ) - Real Estate Services.
=> Read it here.
donderdag 31 januari 2013
Savings Rate Points to a Deja Vu Recession
Remember where I said this:
"Unlike in 2008, the savings rate isn't going up though (Chart 5). If this trend actually reverses upwards, the real collapse will start because when people save money, debt will be paid off and the currency supply will drop."
It has finally happened, the savings rate is going up to 6% (Chart 1). Credit is being repaid, the currency supply is going to shrink and the economy is on the verge of collapse, again.
The GDP has gone negative, if we get another negative growth in GDP, then we have a recession.
The GDP has gone negative, if we get another negative growth in GDP, then we have a recession.
 |
| Chart 1: Personal Savings Rate |
zaterdag 17 november 2012
Fiscal Cliff: Savings Rate to go into Negative Territory
The fiscal cliff which is right in front of us will arrive on January 1st, 2013. The most important change will be the expiration of the Bush tax cuts. Each citizen of the U.S. will have a tax hike starting next year. The result will be a decline in savings rate. Tax rate can be said to affect the savings inversely both in the personal and corporate levels. It means that in the cases when the tax rate increases, the rate of savings may fall while with decrease in the tax rate, the savings may increase.
So what does this mean in simple numbers? If I earn 3000 dollars and I am taxed 33%, I will have 2000 dollars of disposable income. If I save only 3% of my disposable income (see chart 1). I am saving 60 dollars. If now the taxes on my personal income go up 3%, I will need to hand over 90 dollars to the government. My disposable income will be 1910 dollars. This means I'm going underwater: 60-90 = -30.
Overall, the personal income tax rate will go up 3% with the exception of the lowest and highest income earners who will have a whopping 5% tax increase. This tax increase will therefore reduce the disposable income of each and every person and business in the U.S.
So what does this mean in simple numbers? If I earn 3000 dollars and I am taxed 33%, I will have 2000 dollars of disposable income. If I save only 3% of my disposable income (see chart 1). I am saving 60 dollars. If now the taxes on my personal income go up 3%, I will need to hand over 90 dollars to the government. My disposable income will be 1910 dollars. This means I'm going underwater: 60-90 = -30.
 |
| Chart 1: Personal Savings Rate |
Continue reading here.
Abonneren op:
Posts (Atom)