- List of Correlations
- Gold Checklist
- Copper Checklist
- Gold Forecaster
- Oil Forecaster
- Stock Forecaster
- Bond Forecaster
- USD Forecaster
- Poo Forecaster
- Bitcoin Checklist
- Q Ratio
- Stock Valuation
- Leading/Coincident Indicator
- Misery Index
- Junk Bonds Vs. Stocks
- Currency Vs. Bonds
- Yield Curve Vs. Fed Funds Rate
- U.S. Bond Yields
- Dividend Yield Vs. Bond Yield
- QE Vs. Bond Yields
- Money Supply
- Dow Theory
- Excess Reserves
- Central Bank Balance Sheets
- Fed Balance Sheet Vs. Dow Jones
- Credit Spread Vs S&P
- Total credit Vs. Dow Jones
- Debt
- Debt Vs. Delinquency
- % Debt Held by Foreigners
- Interest Payment on Government Debt
- Disposable Income Vs. Housing
- Retail Sales Vs. Disposable Income
- Tax Revenue Vs. Stocks
- Tax Revenue Vs. Savings Rate
- NIIP Vs. Currency
- Trade Balance Vs. Currency
- Deficit
- Deficit to Outlay Ratio
- China Power Consumption Vs. China GDP
- Freight Vs. GDP
- Inventory Vs. GDP
- PCE Vs. GDP
- GDP Vs. Trade Balance
- GDP Vs. 10 Year Bond Yield
- GDP Vs. PMI
- Profits Vs. Employment
- Employment-Population Ratio Vs. Wages
- Employment-Population Ratio Vs. GDP per Capita
- Unemployment Vs. GDP
- Part-time Employment
- Productivity Vs. CPI
- Output Gap Vs. CPI
- Taylor Rule Rate Vs. Gold
- PPI/CPI/PCE
- Retail Sales Vs. CPI
- 2 Year Vs. LIBOR/SOFR Vs. Fed Funds Rate
- Loan Growth Vs. Fed Funds Rate
- Fed Funds Rate Vs. CPI
- Fed Funds Rate Vs. Unemployment
- Delinquencies Vs. Unemployment
- Delinquency Vs. Fed Funds Rate
- Labor Force Vs. Unemployment
- Non-Farm Payrolls Vs. Unemployment
- Quits Rate Vs. Wage Inflation
- Wage Inflation Vs. Unemployment
- Wage Inflation Vs. CPI
- M2 Vs. CPI
- Capacity Utilization Vs. CPI
- Capacity Utilization Vs. Unemployment
- New Homes Vs. Rents
- Lumber Vs. Housing
- Savings Vs. Housing
- Housing Starts Vs. Unemployment
- Initial Jobless Claims Vs. S&P
- Consumer Sentiment Vs. S&P
- Durable Goods Orders Vs. S&P
- Building Permit Vs. Housing
- Construction Vs. Housing
- Adjustable Mortgage Vs. Fed Funds Rate
- Fixed Mortgage Rates Vs. 30 Year Bond Yield
- MZM Vs. 10 Year Bond Yield
- Gold Vs. 10 Year Bond Yield
- Dow/Gold Ratio
- GOFO Vs. Gold
- Gold/Silver COMEX
Posts tonen met het label Ben. Alle posts tonen
maandag 7 december 2015
zaterdag 9 mei 2015
woensdag 26 juni 2013
The Housing Bubble is Deflating
With the recent surge in the mortgage yields, let's see how the housing market is doing. The two key metrics to look at are mortgage rates and household income. Let's analyze the mortgage rates first.
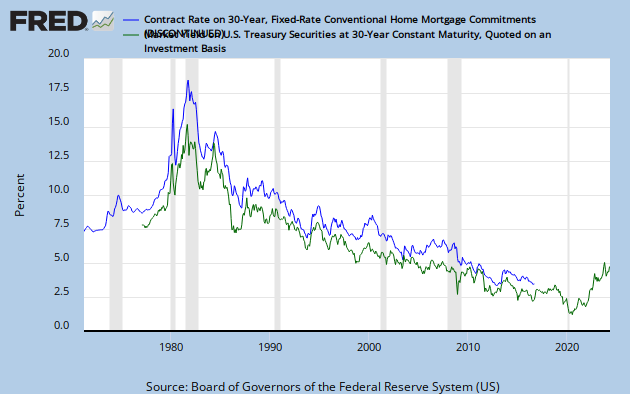
Historically, there is a high correlation between 30 year U.S. treasuries and 30 year mortgage rates (Chart 1). The chart shows that the 30 year treasury yield has spiked upwards starting in 2013, so I expect that the 30 year mortgage rates will spike upwards too. 30 year mortgage rates have already gone up from 3% to 4.9%, which had negative consequences for the real estate market, which is not priced in yet in the housing index.
As Zero Hedge reports, the affordability of housing is declining rapidly with rising mortgage yields. Every percentage increase in yields on 30 year mortgages will result in a 10% decline in affordability as the chart shows. If yields continue to go up to 6%, affordability would have declined about 40% since 2013.
The question is, will mortgage rates go up further? And what about the savings rate of the average citizen?
The answer is that real estate should be sold out of. Kyle Bass for example sold out of three of his real estate holdings: Newcastle Investment Corp (NCT), Hyatt Hotels Corporation (H) and Realogy Holdings Corp. (RLG ) - Real Estate Services.
=> Read it here.
Historically, there is a high correlation between 30 year U.S. treasuries and 30 year mortgage rates (Chart 1). The chart shows that the 30 year treasury yield has spiked upwards starting in 2013, so I expect that the 30 year mortgage rates will spike upwards too. 30 year mortgage rates have already gone up from 3% to 4.9%, which had negative consequences for the real estate market, which is not priced in yet in the housing index.
| Chart 1: Correlation between 30 year treasury yield and 30 year mortgage yield |
As Zero Hedge reports, the affordability of housing is declining rapidly with rising mortgage yields. Every percentage increase in yields on 30 year mortgages will result in a 10% decline in affordability as the chart shows. If yields continue to go up to 6%, affordability would have declined about 40% since 2013.
| Chart 2: House Purchasing Power |
The answer is that real estate should be sold out of. Kyle Bass for example sold out of three of his real estate holdings: Newcastle Investment Corp (NCT), Hyatt Hotels Corporation (H) and Realogy Holdings Corp. (RLG ) - Real Estate Services.
=> Read it here.
donderdag 20 juni 2013
Warning: Deflation is on the horizon
As we know, Ben Bernanke sinked the markets yesterday and this has consequences.
As the premium on silver of some silver miners soars to 30%, we are getting to a point where mining companies are actually losing money, especially when they have mining projects in development. At these prices, nobody is going to invest in exploration companies as they would lose money in doing so.
On the other front, namely bonds, we see the U.S. treasury market decline in price while yields rise.
These high yields in bonds and mortgage yields will in turn crash the stock market and the housing market respectively, if the Federal Reserve stops its monetary easing.
These events are very deflationary, if Ben Bernanke doesn't up its QE, we will need to position ourselves in deflationary assets like cash and bonds.
Michael Pento warns for deflation in this status update.
http://www.pentoport.com/mp3/MRC130619.mp3
zondag 8 juli 2012
How Likely is QE3? 70% likely.
Ben Bernanke has been saving his ammo in the past months. Each time the fed meeting was held, markets were hoping for QE3, but they didn't receive any. This is evidence by the U.S. federal reserve balance sheet on Chart 1.
Today, we have passed several months and we already see that the economy is starting to deteriorate. Not only in Europe and the emerging markets, but especially in the United States. In this article I will focus on the key macroeconomic data in the U.S.
![]() |
| Chart 1: U.S. Federal Reserve Balance Sheet |
Today, we have passed several months and we already see that the economy is starting to deteriorate. Not only in Europe and the emerging markets, but especially in the United States. In this article I will focus on the key macroeconomic data in the U.S.
Abonneren op:
Posts (Atom)