Initial jobless claims will rise. Prepare for gold to shoot up.
- List of Correlations
- Gold Checklist
- Copper Checklist
- Gold Forecaster
- Oil Forecaster
- Stock Forecaster
- Bond Forecaster
- USD Forecaster
- Poo Forecaster
- Bitcoin Checklist
- Q Ratio
- Stock Valuation
- Leading/Coincident Indicator
- Misery Index
- Junk Bonds Vs. Stocks
- Currency Vs. Bonds
- Yield Curve Vs. Fed Funds Rate
- U.S. Bond Yields
- Dividend Yield Vs. Bond Yield
- QE Vs. Bond Yields
- Money Supply
- Dow Theory
- Excess Reserves
- Central Bank Balance Sheets
- Fed Balance Sheet Vs. Dow Jones
- Credit Spread Vs S&P
- Total credit Vs. Dow Jones
- Debt
- Debt Vs. Delinquency
- % Debt Held by Foreigners
- Interest Payment on Government Debt
- Disposable Income Vs. Housing
- Retail Sales Vs. Disposable Income
- Tax Revenue Vs. Stocks
- Tax Revenue Vs. Savings Rate
- NIIP Vs. Currency
- Trade Balance Vs. Currency
- Deficit
- Deficit to Outlay Ratio
- China Power Consumption Vs. China GDP
- Freight Vs. GDP
- Inventory Vs. GDP
- PCE Vs. GDP
- GDP Vs. Trade Balance
- GDP Vs. 10 Year Bond Yield
- GDP Vs. PMI
- Profits Vs. Employment
- Employment-Population Ratio Vs. Wages
- Employment-Population Ratio Vs. GDP per Capita
- Unemployment Vs. GDP
- Part-time Employment
- Productivity Vs. CPI
- Output Gap Vs. CPI
- Taylor Rule Rate Vs. Gold
- PPI/CPI/PCE
- Retail Sales Vs. CPI
- 2 Year Vs. LIBOR/SOFR Vs. Fed Funds Rate
- Loan Growth Vs. Fed Funds Rate
- Fed Funds Rate Vs. CPI
- Fed Funds Rate Vs. Unemployment
- Delinquencies Vs. Unemployment
- Delinquency Vs. Fed Funds Rate
- Labor Force Vs. Unemployment
- Non-Farm Payrolls Vs. Unemployment
- Quits Rate Vs. Wage Inflation
- Wage Inflation Vs. Unemployment
- Wage Inflation Vs. CPI
- M2 Vs. CPI
- Capacity Utilization Vs. CPI
- Capacity Utilization Vs. Unemployment
- New Homes Vs. Rents
- Lumber Vs. Housing
- Savings Vs. Housing
- Housing Starts Vs. Unemployment
- Initial Jobless Claims Vs. S&P
- Consumer Sentiment Vs. S&P
- Durable Goods Orders Vs. S&P
- Building Permit Vs. Housing
- Construction Vs. Housing
- Adjustable Mortgage Vs. Fed Funds Rate
- Fixed Mortgage Rates Vs. 30 Year Bond Yield
- MZM Vs. 10 Year Bond Yield
- Gold Vs. 10 Year Bond Yield
- Dow/Gold Ratio
- GOFO Vs. Gold
- Gold/Silver COMEX
Posts tonen met het label jobless. Alle posts tonen
vrijdag 1 maart 2024
woensdag 24 april 2019
Youth Employment Vs. Initial Jobless Claims
Youth employment is a leading indicator for initial jobless claims because young people are the first to get fired.
Labels:
claims,
correlation,
Employment,
initial,
jobless,
youth
vrijdag 30 november 2018
Initial Jobless Claims Vs. Unemployment Rate
Initial Jobless Claims are a leading indicator for the Civilian Unemployment Rate.
Initial jobless claims report the number of individuals who have filed for unemployment insurance benefits in the previous week (mostly involuntary layoff). This gives us near real-time data on the state of the labor market. The blue chart leads the red chart with a 3 month delay.
Labels:
claims,
correlation,
initial,
jobless,
rate,
unemployment
donderdag 20 juni 2013
Initial Jobless Claims starting to rise, S&P in for a correction
This week's initial jobless claims were rising again as reported by Zero Hedge and based on the obvious correlation between the S&P and initial jobless claims here, I expect that the S&P will come down eventually.
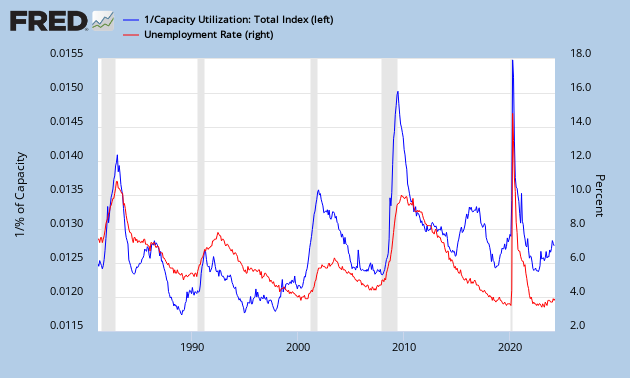
On top of that, the capacity utilization for the previous month was edging down (blue chart going up), which confirms that the unemployment rate will start going upwards (red chart going up).
While deflation sets in with a lower CPI (red chart going down).
zondag 21 april 2013
Initial Jobless Claims Vs. S&P
This page is created to monitor the Initial Jobless Claims Vs. Standard & Poor's Index (S&P).
Whenever you get higher initial jobless claims (blue chart goes down), the S&P follows suit (red chart goes down).
Initial claims are a leading indicator for the unemployment rate.
Historically, when initial claims go above 430K, economic conditions soften.
Abonneren op:
Posts (Atom)