This week's initial jobless claims were rising again as reported by Zero Hedge and based on the obvious correlation between the S&P and initial jobless claims here, I expect that the S&P will come down eventually.
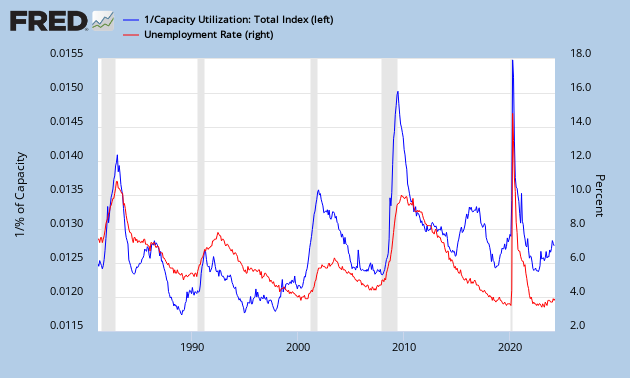
On top of that, the capacity utilization for the previous month was edging down (blue chart going up), which confirms that the unemployment rate will start going upwards (red chart going up).
While deflation sets in with a lower CPI (red chart going down).
As an extra we found out that China's GDP grew to 8%. This is all in line with the positive PMI numbers we got last month. And we all know that China's GDP consists mainly of production (60%) and consumption of commodities as I pointed out here. So, I expect a higher commodities market and with that a higher stock market, mainly in Asia.
It's fascinating how many correlations there exist in the economic world. Today I found this one: Capacity Utilization Vs. Unemployment are inversely correlated. And the best part is: the capacity utilization rate is a leading indicator for unemployment, meaning the trend in the capacity utilization rate can predict the trend in the unemployment rate.
Do you know what this means? If we just look at the capacity utilization (which is a leading indicator), we can predict the unemployment rate. And if we can predict the unemployment rate, we can predict the retail sales, GDP growth, current account deficit/surplus, currency ratio, etc... I could never believe capacity utilization rate could be so important and significant.
The capacity utilization rate was basically flat at 77.8% for the month of October 2012. Due to hurricane "Sandy", it is estimated that total output dropped 1%, resulting in a lower capacity utilization compared to the capacity utilization rate of 78.2% the previous month.
There is one positive area though and that's the mining sector. The capacity utilization rate in the mining industry increased to a 4 year high of 90.4. This is 3.1% above its historical average.
In an interview with David Morgan this week we noticed that the silver mining supply wouldn't be able to keep up with the demand in the coming years. He forecasts that we will come into a silver deficit starting from the year 2014.
For all those who are concerned that precious metals will go down for the rest of this year, there is some light at the end of the tunnel.
Capacity utilization rate for the total industry was up to 78.3% in September 2012 from 78% in August 2012. In particular, the mining industry recovered well, from 88.4% in August to 89.1% in September.
While looking at these numbers, I don't see precious metals crashing just yet.
The probable reason for Australia's declining capacity utilization rate is a slowdown in China, which can also be seen in their capacity utilization rate, which is at a record low of 60% according to the IMF.
The newest number on capacity utilization is 79 % for the total industry in May 2012. This is basically the same as the previous month.
Interestingly, the capacity utilization for the mining industry is much higher at 89.2 %, up from 88.5 % the previous month. This is positive for the mining shares.
Utilities inched up to 76.5 % from 76 % the previous month.
Capacity Utilization in March was 78.6% for the total industry, which is 0.1% lower than the previous month (Chart 1). I expected a bigger decline, but was surprised that it fell so little. Maybe there is hope that it will go up in the future, which is good for gold. To see my analysis on gold, go to my article: Capacity Utilization for March 2012.