Posts tonen met het label non. Alle posts tonen

vrijdag 5 juni 2020

Non Farm Payrolls Smash Expectations

The market was expecting 7.25 million of job losses, but instead we gained 2.5 million jobs. This is a huge beat and should push stocks higher. We will see if these green shoots continue...

zaterdag 18 januari 2020

China non performing loans

The Chinese state owned banks are the last banks standing.
Rural and city bank NPL's are rising.


vrijdag 10 januari 2020

Bad Non Farm Payrolls: 145K

As I predicted in my gold forecaster index video, non farm payrolls were missing estimates because I knew hirings were in the dumps.


vrijdag 17 januari 2014

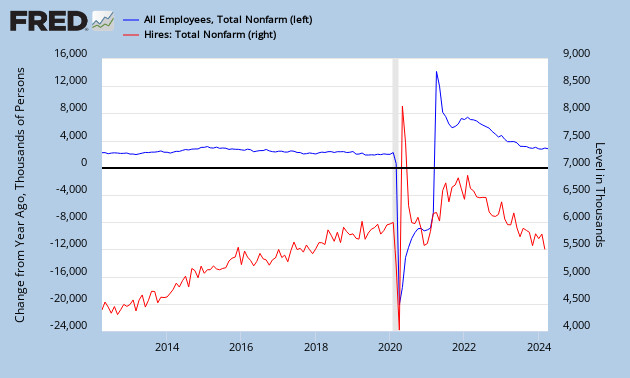
Change in Total Non Farm Payrolls Vs. Job Hires

A Zerohedge article describes how job hires are correlated to the change in payrolls.

A discrepancy occurred from 2010 onwards as layoffs went down.

1) The nonfarm payroll number is a measure of the number of U.S. workers in the economy that excludes proprietors, private household employees, unpaid volunteers, farm employees, and the unincorporated self-employed.

2) The job hire number is the amount of people that are actually getting a job per month. So if job hires increase, the amount of workers in the economy increase, if all else stays equal.

But the amount of workers in the economy also depends on the amount of layoffs.
=> Change in amount of workers in the economy (blue chart) = job hires (red chart) - layoffs

A discrepancy occurred from 2010 onwards as layoffs went down. So the increase in payrolls was not due to increased hiring, but due to a decrease in layoffs.

Conclusion: The importance of monitoring this chart is to know how much of the increase in payrolls is due to hiring. Because hiring is the real driver in the jobs market.


dinsdag 10 september 2013

Net Turnover Vs. Change in Non-Farm Payrolls Vs. Change in Unemployment Rate

The non-farm payroll number is a leading indicator for the unemployment rate. Check the economic tracker to predict the NFP numbers.


Watch the household employment level vs. non-farm payrolls. Household employment level surveys actually include small businesses unlike non-farm payrolls. Household employment is a leading indicator as small businesses adapt much faster than large businesses.


NFP revisions.


There is another way to calculate the non-farm payroll numbers and this is called the JOLTS (Job Openings and Labor Turnover) data. When you subtract hires and separations from each other, you get the change in non-farm payroll numbers.

Change in NFP = Hires - Separations.

JOLTS data is more accurate than the NFP data (which gets revised a lot). You can use the JOLTS data to predict the NFP data and with NFP data, you can predict the trend of the unemployment rate.

Job postings give an idea of the trend.
   

Daily Linkup data.


The Beveridge Curve states that the unemployment rate will rise when job vacancies drop below 5%.


Leading indicator for U.S. unemployment can be derived from the states data.


Distribution between native and foreign workers.


A good way to forecast the unemployment rate is to look at the S&P Global U.S. services PMI employment, reported via the flash PMI.


Employment PMI and unemployment rate are correlated.


Job gap. The US labor market has reached a critical threshold: The jobs-workers gap has turned negative, signalling that the economy has reached the flat side of the Beveridge curve. A further decline in job openings could push it into recession.