Stocks bottomed.
- List of Correlations
- Gold Checklist
- Copper Checklist
- Gold Forecaster
- Oil Forecaster
- Stock Forecaster
- Bond Forecaster
- USD Forecaster
- Poo Forecaster
- Bitcoin Checklist
- Q Ratio
- Stock Valuation
- Leading/Coincident Indicator
- Misery Index
- Junk Bonds Vs. Stocks
- Currency Vs. Bonds
- Yield Curve Vs. Fed Funds Rate
- U.S. Bond Yields
- Dividend Yield Vs. Bond Yield
- QE Vs. Bond Yields
- Money Supply
- Dow Theory
- Excess Reserves
- Central Bank Balance Sheets
- Fed Balance Sheet Vs. Dow Jones
- Credit Spread Vs S&P
- Total credit Vs. Dow Jones
- Debt
- Debt Vs. Delinquency
- % Debt Held by Foreigners
- Interest Payment on Government Debt
- Disposable Income Vs. Housing
- Retail Sales Vs. Disposable Income
- Tax Revenue Vs. Stocks
- Tax Revenue Vs. Savings Rate
- NIIP Vs. Currency
- Trade Balance Vs. Currency
- Deficit
- Deficit to Outlay Ratio
- China Power Consumption Vs. China GDP
- Freight Vs. GDP
- Inventory Vs. GDP
- PCE Vs. GDP
- GDP Vs. Trade Balance
- GDP Vs. 10 Year Bond Yield
- GDP Vs. PMI
- Profits Vs. Employment
- Employment-Population Ratio Vs. Wages
- Employment-Population Ratio Vs. GDP per Capita
- Unemployment Vs. GDP
- Part-time Employment
- Productivity Vs. CPI
- Output Gap Vs. CPI
- Taylor Rule Rate Vs. Gold
- PPI/CPI/PCE
- Retail Sales Vs. CPI
- 2 Year Vs. LIBOR/SOFR Vs. Fed Funds Rate
- Loan Growth Vs. Fed Funds Rate
- Fed Funds Rate Vs. CPI
- Fed Funds Rate Vs. Unemployment
- Delinquencies Vs. Unemployment
- Delinquency Vs. Fed Funds Rate
- Labor Force Vs. Unemployment
- Non-Farm Payrolls Vs. Unemployment
- Quits Rate Vs. Wage Inflation
- Wage Inflation Vs. Unemployment
- Wage Inflation Vs. CPI
- M2 Vs. CPI
- Capacity Utilization Vs. CPI
- Capacity Utilization Vs. Unemployment
- New Homes Vs. Rents
- Lumber Vs. Housing
- Savings Vs. Housing
- Housing Starts Vs. Unemployment
- Initial Jobless Claims Vs. S&P
- Consumer Sentiment Vs. S&P
- Durable Goods Orders Vs. S&P
- Building Permit Vs. Housing
- Construction Vs. Housing
- Adjustable Mortgage Vs. Fed Funds Rate
- Fixed Mortgage Rates Vs. 30 Year Bond Yield
- MZM Vs. 10 Year Bond Yield
- Gold Vs. 10 Year Bond Yield
- Dow/Gold Ratio
- GOFO Vs. Gold
- Gold/Silver COMEX
vrijdag 29 juli 2022
donderdag 28 juli 2022
Nordstream natural gas flows down to 20%
woensdag 27 juli 2022
zaterdag 23 juli 2022
Euro Crash
Equity Allocation Vs. Stock Returns
Construction Activity Vs. Home Prices
vrijdag 15 juli 2022
donderdag 14 juli 2022
Charles Nenner on Commodities
Nenner says commodities will go up in the coming year starting from November 2022.
woensdag 13 juli 2022
maandag 11 juli 2022
Natural Gas Situation in Europe
Natural gas flows to Europe are dangerously low.
LNG imports are at all time highs.
zaterdag 9 juli 2022
Temporary Workers Vs. S&P500
Temporary workers are a leading indicator for a recession as they are easy to be fired.
donderdag 7 juli 2022
woensdag 6 juli 2022
China fertilizer exports plummet
Yardeni decreases outlook for S&P500
Yardeni decreased the outlook for SP500 from 3315-4080 to 3290-3995 in 2022 and from 4125-4675 to 3825-4590 in 2023.
New:
Old:
dinsdag 5 juli 2022
vrijdag 1 juli 2022
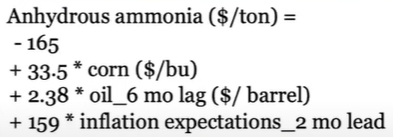
Gregg Ibendahl Ammonia Forecaster
The Gregg Ibendahl formula is a leading indicator for ammonia prices and can be used to accurately predict fertilizer prices.
Potash To Rise 50%
Potash is expected to rise further, possibly 50%.
The model also predicted potash prices could rise to $1,200/ton, while MAP prices could be in the $1,470/ton range, he said.
For some perspective, the highest average retail fertilizer price tracked by DTN for anhydrous this spring was $1,534/ton. For potash prices, the high point was set at $881/ton, while MAP peaked at $1,083/ton.


