- List of Correlations
- Gold Checklist
- Copper Checklist
- Gold Forecaster
- Oil Forecaster
- Stock Forecaster
- Bond Forecaster
- USD Forecaster
- Poo Forecaster
- Bitcoin Checklist
- Q Ratio
- Stock Valuation
- Leading/Coincident Indicator
- Misery Index
- Junk Bonds Vs. Stocks
- Currency Vs. Bonds
- Yield Curve Vs. Fed Funds Rate
- U.S. Bond Yields
- Dividend Yield Vs. Bond Yield
- QE Vs. Bond Yields
- Money Supply
- Dow Theory
- Excess Reserves
- Central Bank Balance Sheets
- Fed Balance Sheet Vs. Dow Jones
- Credit Spread Vs S&P
- Total credit Vs. Dow Jones
- Debt
- Debt Vs. Delinquency
- % Debt Held by Foreigners
- Interest Payment on Government Debt
- Disposable Income Vs. Housing
- Retail Sales Vs. Disposable Income
- Tax Revenue Vs. Stocks
- Tax Revenue Vs. Savings Rate
- NIIP Vs. Currency
- Trade Balance Vs. Currency
- Deficit
- Deficit to Outlay Ratio
- China Power Consumption Vs. China GDP
- Freight Vs. GDP
- Inventory Vs. GDP
- PCE Vs. GDP
- GDP Vs. Trade Balance
- GDP Vs. 10 Year Bond Yield
- GDP Vs. PMI
- Profits Vs. Employment
- Employment-Population Ratio Vs. Wages
- Employment-Population Ratio Vs. GDP per Capita
- Unemployment Vs. GDP
- Part-time Employment
- Productivity Vs. CPI
- Output Gap Vs. CPI
- Taylor Rule Rate Vs. Gold
- PPI/CPI/PCE
- Retail Sales Vs. CPI
- 2 Year Vs. LIBOR/SOFR Vs. Fed Funds Rate
- Loan Growth Vs. Fed Funds Rate
- Fed Funds Rate Vs. CPI
- Fed Funds Rate Vs. Unemployment
- Delinquencies Vs. Unemployment
- Delinquency Vs. Fed Funds Rate
- Labor Force Vs. Unemployment
- Non-Farm Payrolls Vs. Unemployment
- Quits Rate Vs. Wage Inflation
- Wage Inflation Vs. Unemployment
- Wage Inflation Vs. CPI
- M2 Vs. CPI
- Capacity Utilization Vs. CPI
- Capacity Utilization Vs. Unemployment
- New Homes Vs. Rents
- Lumber Vs. Housing
- Savings Vs. Housing
- Housing Starts Vs. Unemployment
- Initial Jobless Claims Vs. S&P
- Consumer Sentiment Vs. S&P
- Durable Goods Orders Vs. S&P
- Building Permit Vs. Housing
- Construction Vs. Housing
- Adjustable Mortgage Vs. Fed Funds Rate
- Fixed Mortgage Rates Vs. 30 Year Bond Yield
- MZM Vs. 10 Year Bond Yield
- Gold Vs. 10 Year Bond Yield
- Dow/Gold Ratio
- GOFO Vs. Gold
- Gold/Silver COMEX
woensdag 27 december 2023
woensdag 20 december 2023
vrijdag 15 december 2023
CAPEX Copper
Capex for copper is declining, which means price should go up.
Goldman Sachs (NYSE:GS) foresees a supply shortfall that will drive the price of copper to $4.50 per pound by late 2024, and to more than $6.80 per pound in 2025.

Goldman Sachs (NYSE:GS) foresees a supply shortfall that will drive the price of copper to $4.50 per pound by late 2024, and to more than $6.80 per pound in 2025.

donderdag 14 december 2023
woensdag 13 december 2023
maandag 11 december 2023
zaterdag 9 december 2023
donderdag 7 december 2023
Copper Treatment charges Vs Surplus/Deficit Market Balance
As copper concentrate deficits widen, treatment charges go down in order to incentivize more supply of copper concentrate to smelters.
Labels:
concentrate,
copper,
TC
dinsdag 5 december 2023
dinsdag 28 november 2023
woensdag 22 november 2023
dinsdag 21 november 2023
vrijdag 17 november 2023
donderdag 16 november 2023
zaterdag 11 november 2023
Copper Expected to Rise
Copper is expected to rise to $4.5/lb according to BNEF.
Confirmed by S&P Global.
woensdag 8 november 2023
Record Natural Gas Production
Labels:
gas,
natural,
production,
supply
dinsdag 7 november 2023
zaterdag 4 november 2023
vrijdag 27 oktober 2023
Bonds and stocks down = commodities up
Labels:
bonds,
commodities,
CRB,
stocks
zondag 15 oktober 2023
Housing Inventory Vs. Housing Starts
When there is too much housing inventory, then housing starts will drop.
vrijdag 13 oktober 2023
vrijdag 6 oktober 2023
woensdag 4 oktober 2023
dinsdag 3 oktober 2023
Federal Reserve Selling Bonds to Pensions
The Fed is selling trashury bonds to the pension funds, which are now deep underwater.
Pension funds buying as market cap increases, but the value of the bonds actually keeps dropping.
zondag 1 oktober 2023
vrijdag 29 september 2023
maandag 25 september 2023
Copper Checklist
To be able to time the copper market you need to take into account a lot of things. Here is a checklist.
1) Kilian Zhou Real Economy Index
The Kilian Zhou Real Economy Index tracks commodity markets.
It’s derived from a panel of dollar-denominated global bulk dry cargo shipping rates.It may be viewed as a proxy for the volume of shipping in global industrial commodity markets.
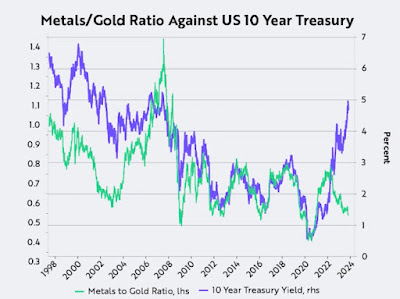
The copper/gold ratio is correlated to the 10 year bond yield.
3) Copper LME Warehouse Stock
Whenever the LME/COMEX warehouse stock level drops, there is a shortage in copper and copper prices will rise. Also check the inventory in China. SHFE copper warehouse stock can be found here. SMM bonded warehouse copper stock level can be found here.
Watch China demand for copper. High power consumption means high China GDP and higher demand for copper.
5) China Credit Impulse
The China credit impulse is a leading indicator for China GDP with a 1 year lag. Make sure it is up.
6) Shanghai Composite Index
The Shanghai Composite Index is correlated to copper price. This is because China heavily depends on commodities. We see a pennant formation shaping up and expect a breakout in 2021.7) GDP
Check the GDP forecast of the St. Louis and Atlanta Fed.
Always check that copper demand is higher than the supply of copper. Demand comes from the electrification trend. Supply is low. When mine supply goes down, copper typically moves higher.
On the supply side, miner Glencore will restart operations at the currently idled Mutanda copper mine in the Democratic Republic of Congo in 2022 (100K tonnes copper/annum) while in top producer Chile a strike at the world's largest Chile's Escondida mine threatens output (1.3 million tonnes copper/annum) and a strike at Andina Codelco copper mine (180k tonnes copper/annum) is looming. MMG's Las Bambas copper mine (400k tonnes copper/annum) had a strike in October 2021 and will shut down in mid December 2021, but reopened in January 2022 and shut down again in April 2022. Teck Resources had a strike on 13 January 2022 (120k tonnes copper/annum). Kamoa Kakula is starting production this month and will ramp up to 400K tonnes copper per year in Q3 2022. Quellaveco will start production in 2022 for 300K tonnes per year. China announced it will release its copper stockpiles into the market (China sold 20K tonnes in June, 30K in July, 30K in September and 30K in October). Stockpiles are at 2 million tonnes). On November 2023, First Quantum indicated it will need to halt production at its Cobre Panama mine, representing 300kt of production or 1.5% of global supply. An indefinite union strike plan was announced at MMG's Las Bambas copper mine in Peru starting Nov. 28 2023 (an ongoing issue at the mine since around 2016), representing another 400kt of copper production or 2% of global supply.
Oct-2025
Dec-2023:
Check the copper scrap supply in China.
Check the premium of refined copper to copper scrap. When this premium goes negative, this means that there is a shortage of copper scrap. This points to a bottom in the copper price. You can find the data here.
Operating rates: Copper rod produced with cathode (red). Copper rod produced with scrap secondary copper (blue). Buy copper when red line is higher than blue line. Typically when scrap secondary copper is scarce and trading at a premium.
9) Seasonality
Check the seasonality of copper.
The COT report gives indication of the short term moves. You want to see open interest come down and you want to see a low amount of commercial shorts.
11) Australian Dollar / Chinese Yuan
Make sure the Australian dollar and the Chinese yuan are in an uptrend.
12) Technicals
Besides all these fundamental reasons above, you need to check the technical picture as well. Buy copper when there is a breakout. (Jesse Livermore: "Follow the path of least resistance")
13) Commodity Cycles
Watch the CRB Index to see if we are in a bullish commodity cycle.
When China copper concentrate imports / China unwrought copper imports rise, commodities rise.
The Baltic Dry Index or bulk shipping rates indicate the demand for commodities. The Capesize vessels 180000 dwt are mainly used for iron ore, while the Supramax (75000 dwt) and Handymax (58000 dwt) are used for copper. HARPEX and FBX are used for container ships. China container index can be found here.
16) Yardeni Forecast
Check the Yardeni forecast for the stock market. Dr. Copper typically moves together with stocks. Follow the Yardeni China briefing numbers.
Are we in inflation or deflation? Make sure it's inflation. Segments contributing to inflation can be found at the Truflation website.
18) Zillow Rent Index
The Zillow Rent Index is a leading indicator for CPI Rent. Make sure it's up.
19) Brave-Butters-Kelley Index
The index is constructed from a large panel (490) of monthly measures of real economic activity and quarterly real GDP growth. Monthly GDP growth is indexed to the quarterly estimates from the U.S. Bureau of Economic Analysis and consists of three components: cycle, trend, and irregular.
Make sure the cycle is up.
20) Charles Nenner Cycle
21) Mannarino Index
Check the Mannarino Index. Low index means low risk, High index means high risk.
22) NAHB Housing Market
Watch the NAHB housing market index.
23) Floor Space Under Construction
As real estate accounts for 20% of China copper demand, make sure that floor space under construction is rising. Check that housing prices are going up in HK and in China.
24) Chinese Airplanes
Follow the chinese airplane data, which is correlated to copper.
25) Centa-City Leading Index
Follow HK housing market and China housing market.
26) Bonded Copper Premium
Index Chinese: https://www.minfutures.com/main/research_center/index.shtml
When the LME is more expensive than the SHFE, then China will import less copper which depresses the copper price. This is the case in beginning 2024, when the SHFE/LME ratio was very low (see red chart which is the LME cash 3m discount). The black chart is the spot/futures premium which signifies demand for copper. A high spot/futures shanghai copper premium means that China is in short supply of copper.
Chinese yields are correlated to copper.
Labels:
copper
Abonneren op:
Reacties (Atom)


