First quarter gold demand of 963 tonnes was down 13% compared with Q1 2012 due to an outflow in the total gold ETF holdings of 177 tonnes. 2013 marks the first year in a decade where ETF's are actually selling gold. While ETF holdings were reduced, this selling has been countered by an increase in physical demand for gold by China and India. Total demand in China rose 20% to 294 tonnes in Q1 2013 as compared to Q1 2012 (50 tonnes increase).
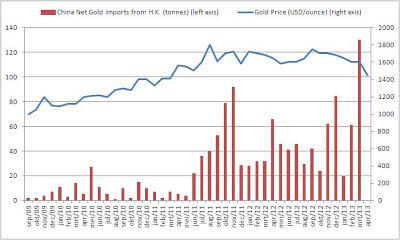
This huge increase in demand for physical gold can be witnessed on Chart 1, which gives the net imports of gold from Hong Kong to China.
 |
On the supply side we see a total increase of 1% in the first quarter of 2013 as compared to Q1 2012. Mine production increased 4% while recycling of gold decreased 4%.
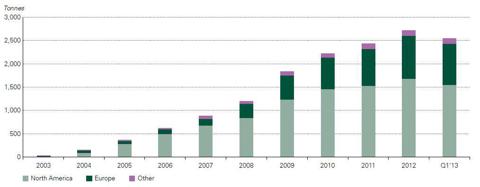
So, the reason for the decline in precious metals prices is evident from an increase in supply (mine production increased) and a decrease in demand for gold (ETF outflows) (Chart 2). But there is an important point I need to make here. While the supply side is pretty constant at 1% increase, the demand side is the critical indicator we need to look at with its 13% decline. The decline was a result of hedge funds converting their gold holdings into equities. The Dow Jones (DIA) hit an all time high last week, fueled by a bullish prospect in the equity market of Japan, which on itself was a result of the massive Japanese monetary stimulus announced in April 2013. Although investors are cheering the bull market in equities, the macroeconomic conditions keep worsening. A few examples were a deterioration in PMI, capacity utilization, ISM manufacturing, vehicle sales, ADP employment, initial claims, PPI, mortgage applications, wages.
To see what this means for gold, read on here.

Good analysis in paper and metal markets.
BeantwoordenVerwijderenbuy gold coins online