woensdag 26 februari 2014

China Gold Imports From Hong Kong Drop In January 2014

Although China gross gold imports in January fell, the net imports stayed relatively flat. The ratio net to gross gold imports stayed strong.

What people don't know is that the high lunar new year demand is still to be felt in the coming months as the SGE vault needs to get replenished.

So I expect the trend to rise, not fall.


zondag 23 februari 2014

Chinese Lunar New Year Ended, Gold Demand Down?

... Absolutely not!

People say that when the Chinese New Year ends (31 January), gold demand would come down.

What do we see two weeks after Chinese New Year? A record amount of Chinese gold demand at 64 tonnes a week, that's 256 tonnes a month, above global mine supply.
SGE Withdrawals (In Gold We Trust: Koos Jansen)

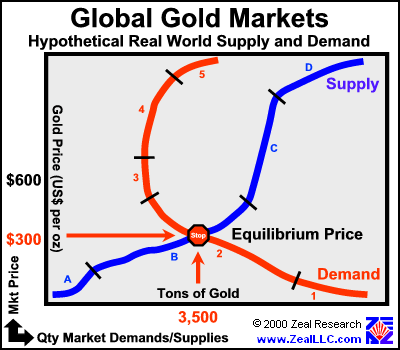
I believe we could see an increase in gold demand when the price of gold rises. It seems counterintuitive, but the gold demand curve is not straight, it is curved (red graph below).

We might see it happening right now.


zaterdag 22 februari 2014

Deposits Over Loans: Excess Reserves

What happened in 2008 was a once in a lifetime event and this is illustrated in the following chart comparison. There was a historic correlation between deposits and loans, but that correlation has broken down since the 2008 financial crisis.

Since 2008, deposits have increased at the banks, but lending by banks has not gone up substantially. All of this money is parked at the Federal Reserve at ultra low interest rates. It is not flowing into the economy and as long as lending doesn't grow, the Fed can't raise interest rates nor taper. More so, the Fed can't stop QE until lending goes up substantially.


The difference between the deposits and the loans are the so called "excess reserves". Historically, a high amount of excess reserves will be quite inflationary, the question is when will we see all of this inflation come? When lending finally starts (red curve goes up), inflationary pressures will come. The Federal Reserve will have to sell its bonds and mortgages, reduce its balance sheet to counter this inflation. Or it can raise interest rates. The question is, will they see this coming or not? Will they act appropriately soon enough or be too late to counter inflation? I'm not counting on it, that's why I protect myself against inflation.

As mentioned before, the amount of excess reserves is the difference between deposits and loans and it is shown in the chart below:
As you can see, we had $2.4 trillion in excess reserves in January 2014, which almost matches the amount of money printing or QE from the Federal Reserve. When this trend reverses, it could mean that lending growth has started, that banks are finally using their excess reserves to buy things and that's the moment when we will see the inflation coming. So monitor this chart!

For more info read this article.

(If you're wondering why there is a bleep in 2010, that's the "Financial Accounting Statements No. 166". This new set of rules deals with the way U.S. banks must handle off-balance-sheet vehicles (OBSVs). They needed to bring these off-balance-sheet items back on their books.)


Since 2015: 

Excess reserves at the Fed have been going down as the Fed started to unwind its balance sheet (blue line). But oddly, deposits minus loans at commercial banks were steady flat (red line). Why is this?

Moreover, this means that there are a lot of deposits but not enough loans. Taking into account that the yield curve is approaching zero (green line), banks need to pay the same interest to depositors (short term maturity) as they receive in loan interest (higher maturity), but this needs to be done on more depositors than loans. The net interest margin will drop.

Which means bank profits will be going down while the Fed reduces its balance sheet and its excess reserves. Less excess reserves also means less money being paid by the Fed to the banks via IOER.

When the blue line approaches zero and the red line doesn't, something magical will happen.

You can already see that the net interest margin is going down due to the flattening yield curve.
That little spike higher in 2016 is because of the tax cuts and because of the rising interest on excess reserves (IOER).

donderdag 20 februari 2014

Gold Bounces off 200 Day Moving Average

You know what's important today? Gold bounced off the 200 day moving average. The green line here, has now become support.

If we go higher from here till $1400/ounce, then we might be starting a whole new bull market in gold, like we saw in 2009.

Let's zoom in a bit.


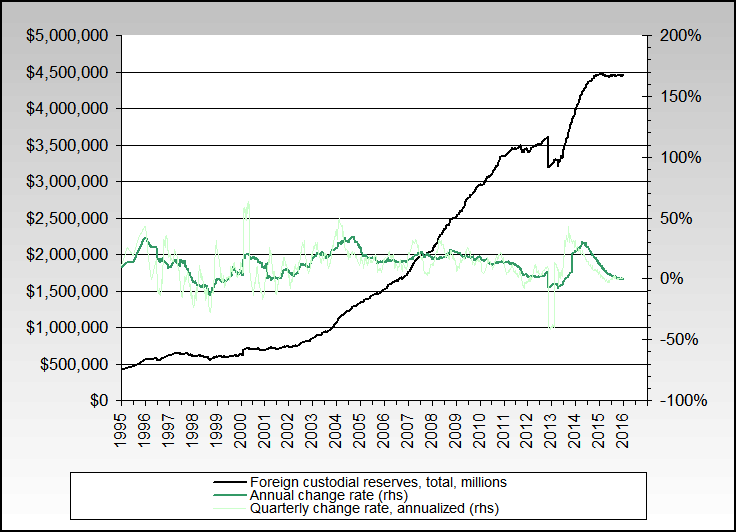
And another thing, even though gold has corrected itself, the M1 money supply and the Fed custodials have kept going up, I expect gold to bounce right upwards in the near future.


Let's zoom in on the Fed custodial reserves. It is soaring. Remember, that bleep downwards is only because the U.S. government fudged the numbers with a new accounting method to create a new series of data points.

Belgium Buys Chinese U.S. Bonds

As a Belgian I cannot believe what our government is doing. China sold $48 billion in U.S. bonds, while Belgium bought $56 billion in U.S. bonds. That means China sold their U.S. treasuries to Belgium and Belgium bought even a bit more of it. 

And it isn't only the month of December 2013. Belgium kept buying the whole year of 2013 and is now the fourth largest U.S. bond holder with $257 billion in U.S. bonds. For such a small country of $500 billion in annual GDP.

I can't imagine what will happen if the U.S. bond market collapses. Belgium will collapse too.

U.S. bond holders

maandag 17 februari 2014

Beleggerscompetitie 2014

Here we go again. Beleggerscompetitie 2014 is the Belgian investing competition, it starts today and you can win a Hyundai. You can follow me here on the katchum account.


Last year I was last place, betting on gold mining stocks and shorting the market. This time I think I'll be a bit higher betting on the same, namely gold mining stocks and shorting the market, I hope...

zondag 16 februari 2014

Eric Sprott PSLV Trust Offering

 If you hadn't noticed yet, the PSLV Trust of Eric Sprott has seen a technical breakout in silver premium. So investors are now paying more to get their hands on the physical silver than paper silver.

If this trend keeps going up, you can be sure that Eric will price another offering of silver trust units to take some silver off the market. He hasn't made an offering in 2 years, I'm sure he's itching to finally have one. Maybe this time will be the last blow to the imbalance in silver supply and demand before the silver price takes off.


Update on Allana Potash and Avino Silver & Gold

Two stocks I have been quietly accumulating on are Allana Potash and Avino Silver & Gold. I believe these two stocks are set to have a good run in the coming year.

Allana Potash, which I have been talking about here and Avino Silver & Gold, which I have been talking about here, both have catalysts.

1) Allana Potash just announced its first tranche of equity financing and more importantly an off-take agreement with ICL Potash to buy the entire production. Basically, ICL Potash has plans to buy about $80 million of the company with equity financing. Of course this will reduce the upside, but it will derisk the project and make the upside in share price more likely. We don't know what the lending side is about yet, but I'm hoping it will be a good deal.

2) Avino Silver & Gold has doubled in value since December 2013 on very good production results. And we aren't even counting in the new production that is coming online later this year with the Avino Mine itself. We also see insider buying in February 2014, so there is much more upside on this stock. And I'm not even counting in the surge in silver price which is sure to come.

Just my two cents...


European Bank Deposit Outflows: The Case of Italy

European bank deposits have seen outflows since the start of 2012, right when the ECB started tightening its balance sheet. Two of the countries most affected were Spain and Greece where the outflows are steepening. Italy has been holding pretty steady.

But more recently, we see that Italy is topping out, right on the breaking news that inbound money transfers to Italy will have a 20% tax imposed on them. I wonder what this will do to the Italian economy as nobody will buy stuff from Italy anymore because the merchants won't be able to make a profit. Everyone will also transfer their money out of Italian bank accounts to foreign bank accounts.

Let's see how fast the deposits will flow out of Italy going forward.


Currency Devaluation in Emerging Markets

The interesting news these days is all about currency devaluation in the emerging markets. Due to the tapering of the Federal Reserve, we now have an unintended consequence. All of the cheap money supplied by the Federal Reserve, that went to the emerging markets, is now coming home. Some of the emerging market countries are already feeling this pressure of currency outflows. As a result they are raising interest rates at a very fast pace which collapses their economies. Although emerging market equities have better valuations than developed market equities, we still see a monthly outflow of $12 billion out of emerging market funds. All of this money is now flowing back into U.S. bonds and more recently into precious metals.
To read my analysis, go here.

For more info you can watch this interview with Gerald Celente.


vrijdag 14 februari 2014

Bitcoin Correlation Breaks Down

One correlation in the Bitcoin world I follow has just broken down. I thought that the Bitcoin price was linked to the amount of unique Bitcoin addresses, but something strange is happening.

Even though the amount of unique Bitcoin addresses is increasing, meaning more addresses are being used for Bitcoin, still, the Bitcoin price is going down.

I don't know what is happening, is this a bug?


woensdag 12 februari 2014

End of GLD outflow

Have we seen the end of the GLD outflows? It sure came faster than I anticipated.

Instead of ETF gold supply coming onto the market, we now get a supply crunch due to ETF gold buying. And this on top of the Chinese who are still buying in record amounts as we can see on the Shanghai Gold Exchange. On top of that we are now again going into backwardation on the 1, 2, 3 month GOFO level and the high grade mine supply is going to decrease going into 2015.

This might as well be the real bottom in gold.


Copper in the process of topping out

If you think copper is bottoming out, I have to disappoint you. The backwardation curve on copper gets steeper and steeper and we still don't see the copper price going up meaningfully. This means copper is weak going forward. It looks more like copper is topping out based on this chart.


zaterdag 8 februari 2014

The Effect of India's Solar Plant Project on Silver Price

We had some big news from India last week. India is about to build the largest solar plant in the world.
Now what effect will this have on silver, because silver is the largest component of a solar panel.

Let's talk about the numbers first. The project is said to produce energy at a rate of 4 gigawatt. The project is done in 7 years. After the first year of construction it will produce 1 gigawatt.

Now, how much silver goes in a typical solar panel? Normally 2/3 ounce per solar panel or 20 grams of silver. A normal solar panel produces 80 watts at 15% efficiency if there is direct sun. So we have 2/3 ounces of silver per 80 watts of energy or 0.008333333 ounces/W.

Let's convert that to gigawatt. Giga is 9 zeroes.

If we use these numbers, then we would need 8333333 ounces of silver per gigawatt (if there is direct sun). Then over the course of the entire project we would need 4 gigawatt or 33 million ounces of silver in 7 years (if there is direct sun).

Now we only have 6 hours of sun a day, so we need to multiply this number by 4 to have 24 hours.  That gives 33 x 4 = 132 million ounces in 7 years or about 20 million ounces a year.

Answer 20 million ounces of silver per annum. That is our silver demand from this India solar panel project.

Now let's see what this means. Annual silver demand from photovoltaic cells is about 50 million ounces per annum. So a 20 million ounce increase per annum would have a significant effect on the chart below. But in the supply and demand picture in the overall silver market, this isn't very significant as silver supply from mines is about 800 million ounces per annum.

Conclusion: Nothing special here, move along ...

vrijdag 7 februari 2014

Bitcoin Crashes

As predicted many times ago, bitcoin is a bubble. Finally, people are starting to realize this. Mt. Gox has now temporarily suspended withdrawals of money from their exchange. Everyone is now rushing to get their money selling their bitcoins. But the funny thing is, this will take more than a month to do so and it will also take 4 weeks to validate your bank account. So in total you won't have your money for probably several months and now they suspend your withdrawal.

Do you really think people want to put their money in a virtual currency, knowing that their exchange could crash/go bankrupt at any time and their money disappear in a second?

Needless to say, the bubble has popped and that is visible in the following graph and it's going to get worse.

Peter Schiff was right... bitcoin is a bubble. You won't have these problems with gold, I can tell you that.


donderdag 6 februari 2014

Japan Carry Trade

When you know your country (in this case Japan) is printing massive amounts of money and is debasing its currency, you can profit from this. You just borrow the debasing currency (yen) at ultra low yields and with that money you buy high yielding assets like the S&P500 or high yielding bonds in other countries.

So if the yen for example declines against the U.S. dollar (blue graph goes up), then you buy the S&P500 (red graph goes up). It also goes the other way round. When the yen starts increasing in value, people are going back into the yen to repay the borrowed currency by selling their high yielding assets.


During a few periods we don't see a correlation because of other phenomenons like: NASDAQ bubble (2000), oversold equities (2009)...

Another example of carry trade is the U.S. debasing its currency with QE while emerging markets profit from this money printing. This carry trade is now unwinding as currency is flowing out of the emerging market currencies.

The key is: monitoring the USD/JPY exchange rate.