There is a correlation between the yield curve and the Fed funds rate.
The yield curve plots the yield on Y-axis and maturity on X-axis. A flattening yield curve means that the yield of the different maturities are coming together and a recession starts.

The yield curve plots the yield on Y-axis and maturity on X-axis. A flattening yield curve means that the yield of the different maturities are coming together and a recession starts.
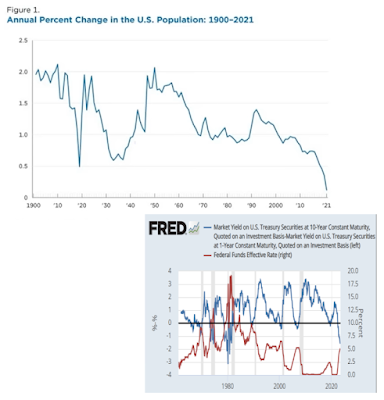
On the following graph, the flattening yield curve can be witnessed by a drop to zero on the blue chart. Whenever this drop happens, a recession starts and the Federal Reserve comes to the rescue by decreasing the Fed funds rate. The problem today is that in the next recession in 2015, the Fed funds rate cannot be lowered anymore (red chart is already at 0%). The Fed is out of bullets.
To check how the yield curve will evolve, you can look at the leading indicator 3-2 year treasury yield.
Yield curve inversions happen when the population growth slows down.
Housing inventory is inversely correlated to the yield curve.


Geen opmerkingen:
Een reactie posten